Drawings as Code – DOT and Graphviz
I like drawings to explain stuff. It's probably the most straightforward way to document things. But the pain of traditional drawings is the inability to track changes to them. It's easy to track changes to text or code by tracking them in a git. It's not easy when it's a binary blob which is what most images are. SVG format helps a lot. I use it as much as possible, but it's still very verbose, and I think not easy to see the diff and understand what happened over time.
This is where I like DOT or Mermaid a lot. They represent a drawing in text format like code and can be rendered into various image formats when required. Here we will look into DOT format and its syntax. We will also look at the tools and integrations available.
DOT is a graph description language. DOT graphs are typically files with the filename extension gv or dot. The extension gv is preferred, to avoid confusion with the extension dot used by versions of Microsoft Word before 2007
Various programs can process DOT files. Some, such as dot, neato, twopi, circo, fdp, and sfdp, can read a DOT file and render it in graphical form. Others, such as gvpr, gc, acyclic, ccomps, sccmap, and tred, read DOT files and perform calculations on the represented graph. Finally, others, such as lefty, dotty, and grappa, provide an interactive interface. The GVedit tool combines a text editor with noninteractive image viewer. Most programs are part of the Graphviz package or use it internally.
Wikipedia
DOT Language
I am not going to write a Language Primer. The DOT Language is relatively small and easy to understand. You should be able to pick it up in one afternoon. Start with this page and once you are done, go to the full guide(pdf).
The important keywords node, edge, graph, digraph, subgraph, and strict. They are case insensitive. A Graphpwiz drawing ( called a graph) can be either a directed graph - digraph (the one which has directions) or undirected graph (no specific direction, and hence both directions work). If it's a diagraph, then the edges will have directions. So they are denoted by ->. In an undirected graph, the edges are denoted by --.
In strict graph, there can be only one edge in one direction. a subgraph is part of a graph that groups together a set of nodes and edges. Can be use for organizing big graphs in a meaningful way.
A node is usually represented by node-id, which is unique. Nodes, Edges and Graphs can have attributes, which are key, value pairs. They are typically used to set up various properties like color.
One can use label attribute to label the node or edge. In the case of node, the node-id becomes the default label. The other most used attributes are color, shape, arrowhead, etc
There are many other attributes, node shapes that you can use to configure or customize your drawing (or graphs). But this should be enough to start.
The file extension of graph files are either .dot or .gv.
Tools
One doesn't need any tool to author the graph. The language is so small that you can do it using a text editor. That said, there are so many tools available for authoring. Of course, your favorite editor should have a plugin. I usually use one of the online editors if I need an editor.
Graphviz is open source graph visualization software. Graph visualization is a way of representing structural information as diagrams of abstract graphs and networks. It has important applications in networking, bioinformatics, software engineering, database and web design, machine learning, and in visual interfaces for other technical domains.
Graphviz
I find tools helpful in converting the dot files into actual images and in visualizing them. Graphviz is the biggest of all of them. I also use xdot.py old but handy tool. Check the list on GUI/Visualizer section on Graphviz website. They have some good ones.
ZimWiki - Integration
ZimWiki allows you to insert a graph using plugin. First enable the plugin (you will have to install the Graphviz) and then its just Insert->Diagram
MkDocs - Integration
For MkDocs install the Python package markdown-inline-graphviz first.
pip install markdown-inline-graphviz
Then add it as a markdown_extension inside mkdocs.yml. Then you should be able to use it as part of your markdown document.
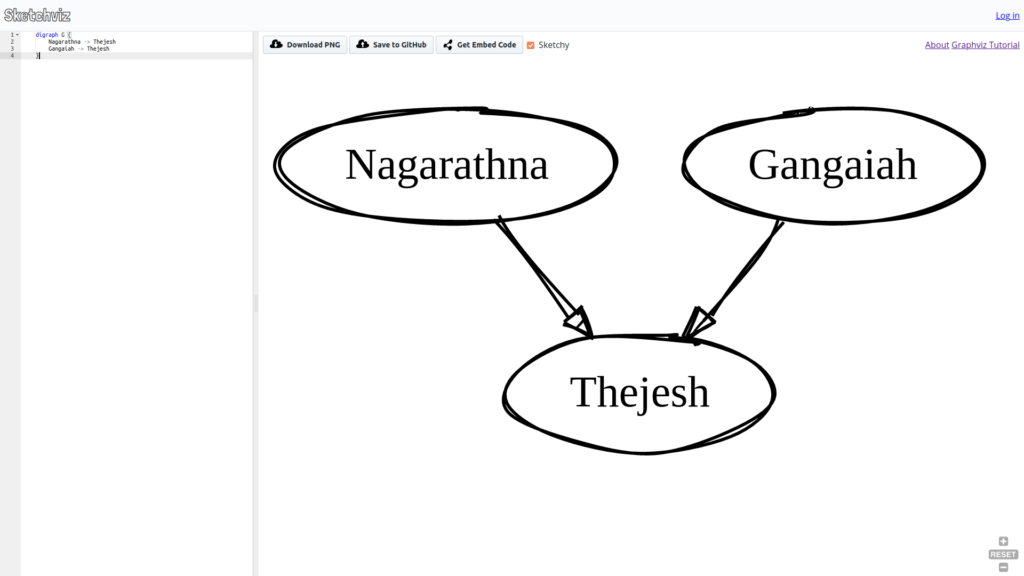
{% dot thejeshgn.svg
    digraph G {
        Nagarathna -> Thejesh
        Gangaiah -> Thejesh
    }
%}
Python
You can create DOT diagram files by hand coding or by using some GUI. But there is another way to generate it programmatically. Why you may ask, there are many reasons. One of them being; you might have large graph data in some other format. You want to create a diagram for it programmatically. You have a dynamic workflow, and you want to generate a diagram to show it visually. And many other reasons.
pip install graphviz
Once you install, you can use it like any other package. You can generate the .dot file or you can generate the image file directly.
from graphviz import Digraph
dot = Digraph(comment='Me')
dot.node('A', 'Gangaiah')
dot.node('B', 'Nagarathna')
dot.node('C', 'Thejesh')
dot.edges(['AC', 'BC'])
dot.format = 'svg'
dot.render('round-table.svg', view=True)