 Lab 5 - Graphs
Created Monday 17 November 2014 - Lab Home
At the end of this lab we should be able to represent the data we analyzed in the last lab in simple but meaningful graphs.
Sample Exercise Questions
- Map the male/female winning opportunities in BBMP
- Scatter plot of BMTC data
Example Data Sets for Lab
- BBMP 2010 Election Results as CSV
- BMTC Data - With Schedules
Tools
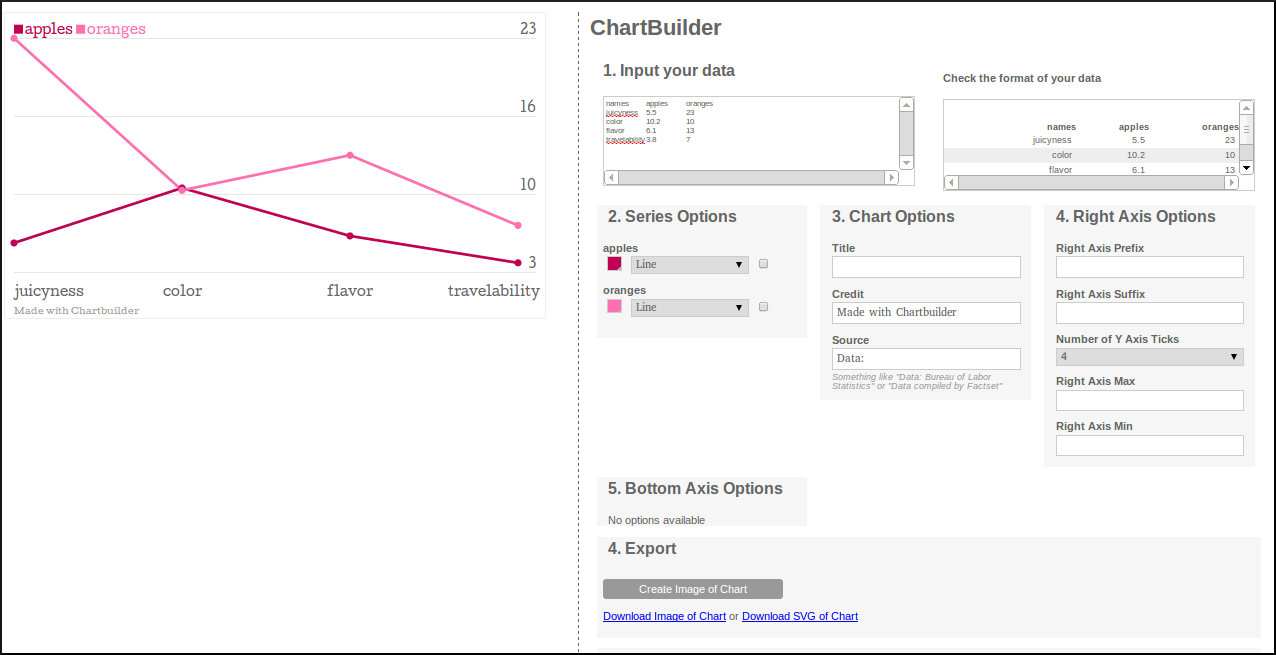
ChartBuilder
- https://quartz.github.io/Chartbuilder/
- Open Source, You can run inside your organization but above link is more than enough
- Embed or download the image for your server
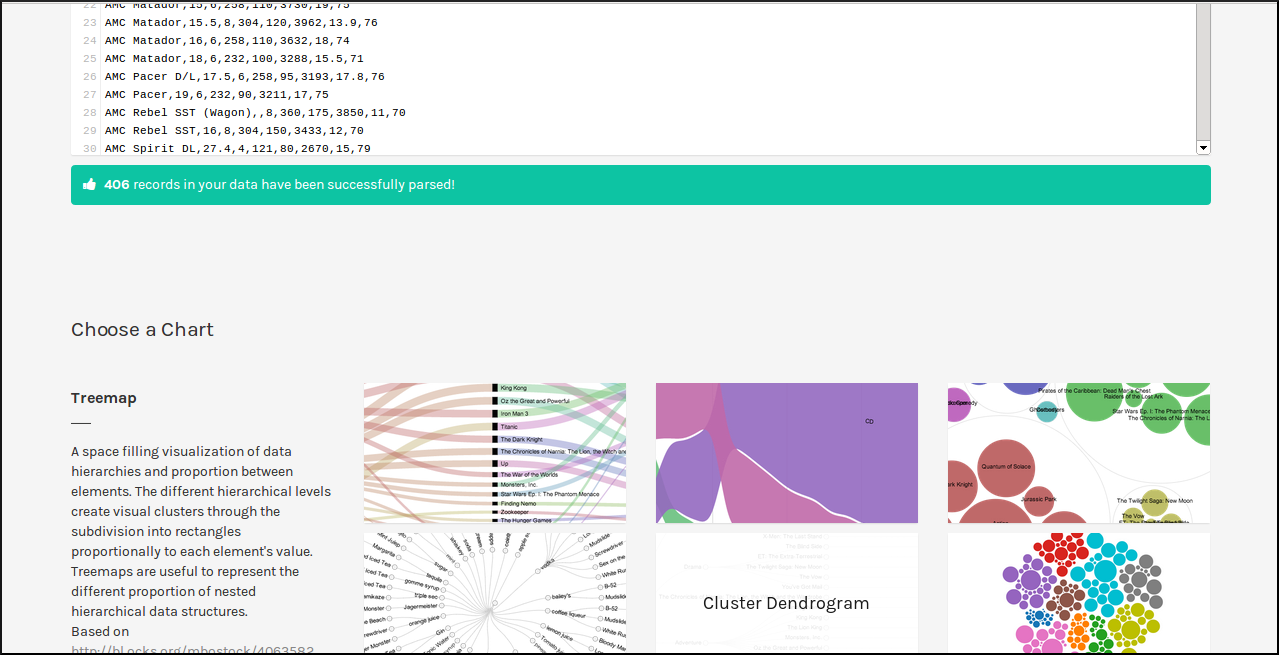
RAW
- http://app.raw.densitydesign.org/
- OpenSource
- Lot of default charts but can also add more
DataWrapper
- https://datawrapper.de/
- OpenSource
- Download or Embed
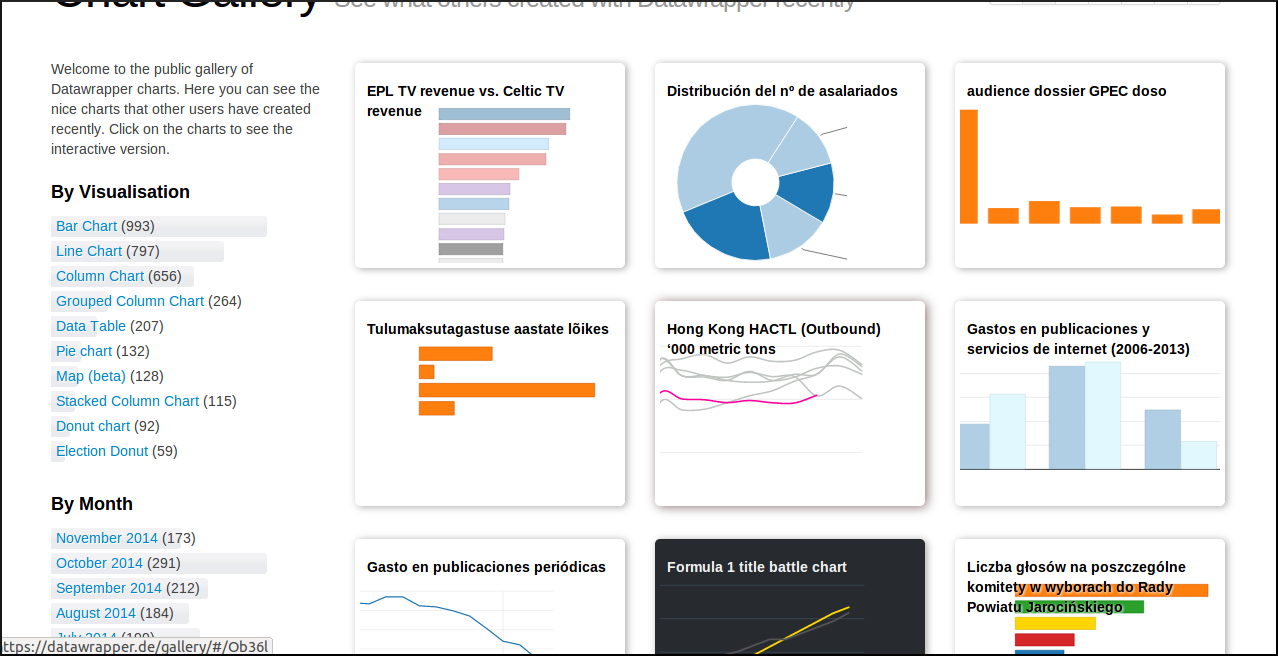
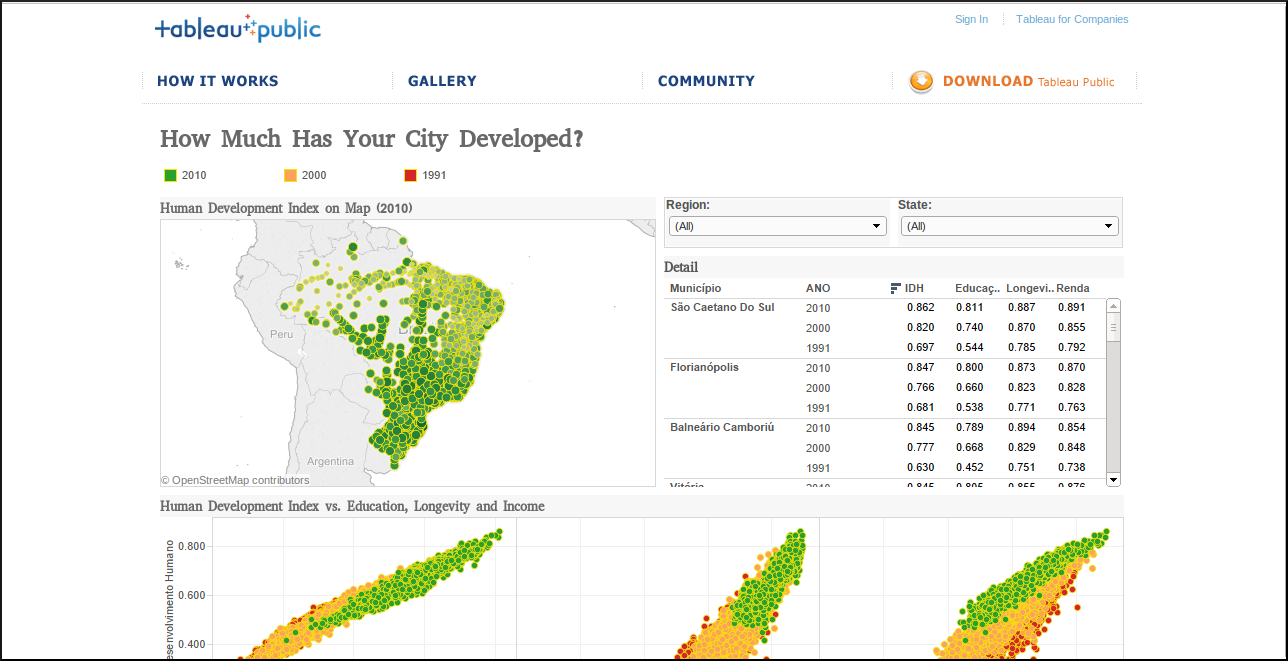
Tableau Software
- http://www.tableausoftware.com/
- Only for Windows and Mac
- Free version makes end results public
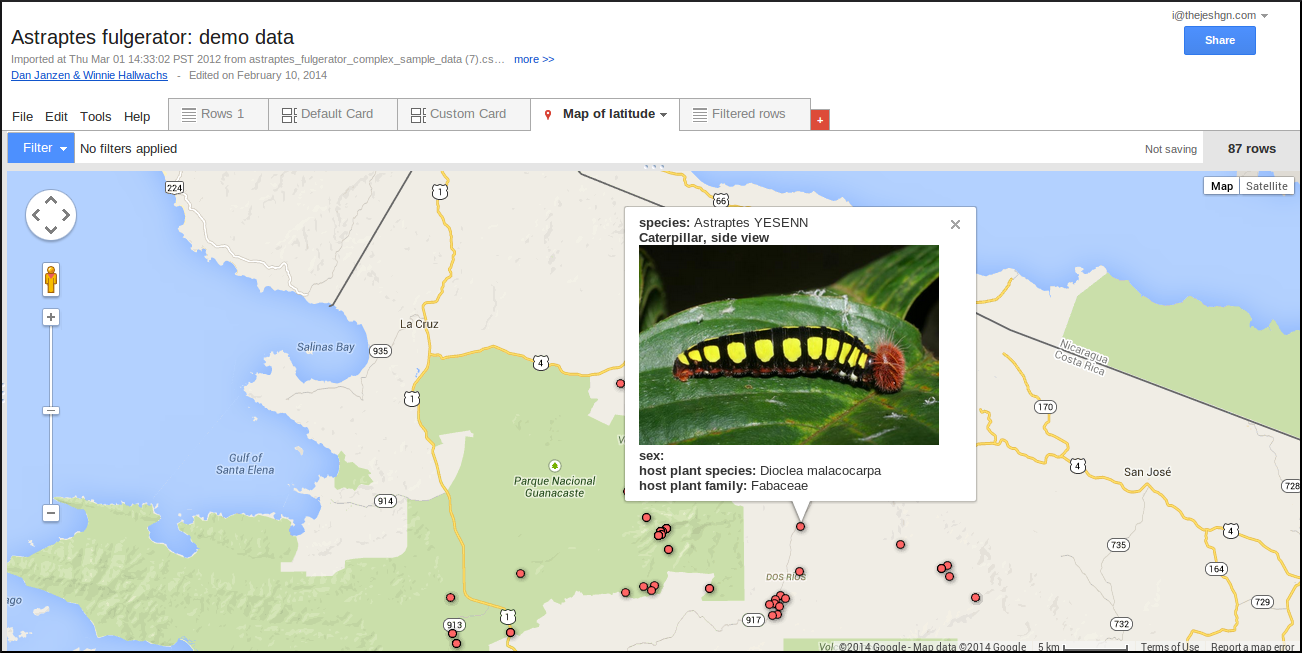
Fusion Tables
- https://www.google.com/fusiontables/
- Charts and Maps
- Download or embed
Other Tools