Table of Contents
Introduction
I wore The FreeStyle Libre Sensor for two weeks in May/June 2016. This was just a fun experimental run as I don’t have any Diabetes. Along with wearing the device I also kept a food dairy1. I have all the data available as CSV.
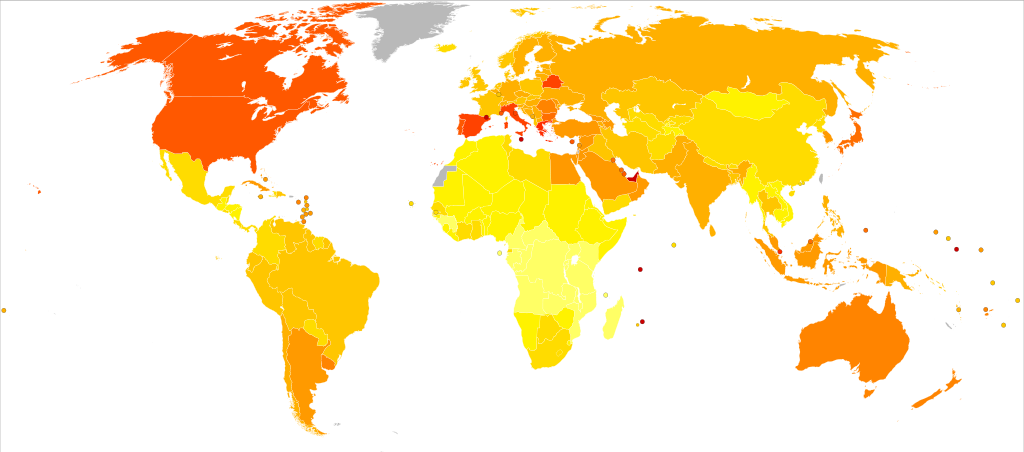
Rates of diabetes worldwide in 2000 (per 1,000 inhabitants) — world average was 2.8%. Src: Wikipedia
The World Health Organization (WHO) estimated that diabetes resulted in 1.5 million deaths in 2012, making it the 8th leading cause of death.2 More than 80% of diabetic deaths occur in low and middle-income countries to which I belong. So its an interesting factor look at for me.
FreeStyle Libre Sensor
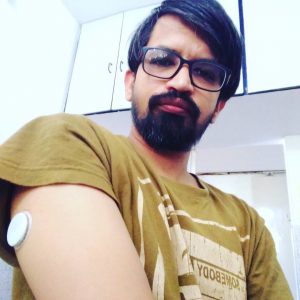 The FreeStyle Libre sensor is wearable (sticker) flash interstitial fluid glucose monitoring system. It is generally applied on to the back of the upper arm. The sensor has a thin, flexible and sterile fibre that is inserted just under the skin. Its painless, you will forget about it after couple of hours. Its waterproof and you can wear it up to 14 days. It captures a value every 15 minutes and stores them.
The sensor has NFC chip to read the values out. If your android phone has an NFC chip then you try LibreLink App else your provider will have a reader which can give you a csv. But remember to use only one of them. Because as per the manufacturer “The FreeStyle Libre sensor communicates with the FreeStyle Libre reader that started it, or the LibreLink app that started it. A sensor started by the FreeStyle Libre reader will also communicate with the LibreLink app, provided that the LibreLink app is used to scan the sensor within an hour of the sensor starting up.”
It’s important to note that it’s an interstitial fluid(ISF) glucose monitoring system. So there will be lag in ISF glucose, with respect to changes in blood glucose, is around 5-10 minutes. The claimed delay by the manufacturer of FreeStyle Libre is 5 minutes. It didn’t matter to me. But if you want to track glucose levels in rapidly changing situations you might need fingerprick test.
Data
There are two datasets. Once CGM and other is my rough food intake. You can download them as csvs. Both the sets are available under ODBL.
Glucose Data
Download the raw data – thejeshgn_cgm1_june2016.csv
| Column Name | Explnation |
| ID | Serial No, Unique for each reading |
| Time | Time when the glucose reading was taken. YYYY/MM/DD hh:mm format. IST |
| Record Type | Not significant for us |
| Historic Glucose (mg/dL) | Historic Glucose values in mg/dL |
Food intake Data
Download the raw data – thejeshgn_food_june2016.csv.
| Column Name | Explnation |
| Datetime | Time when the food was consumed. YYYY-MM-DD hh:mm:ss format. IST |
| Food | What food |
| Quantity | In ml if the type is liquid else gms. |
| Type | Liquid, Solid or Semi Solid |
| Category | Category of food like Drink or Desserts etc |
Charts by Me
Charts by FreeStyle Libre
Ambulatory glucose profile
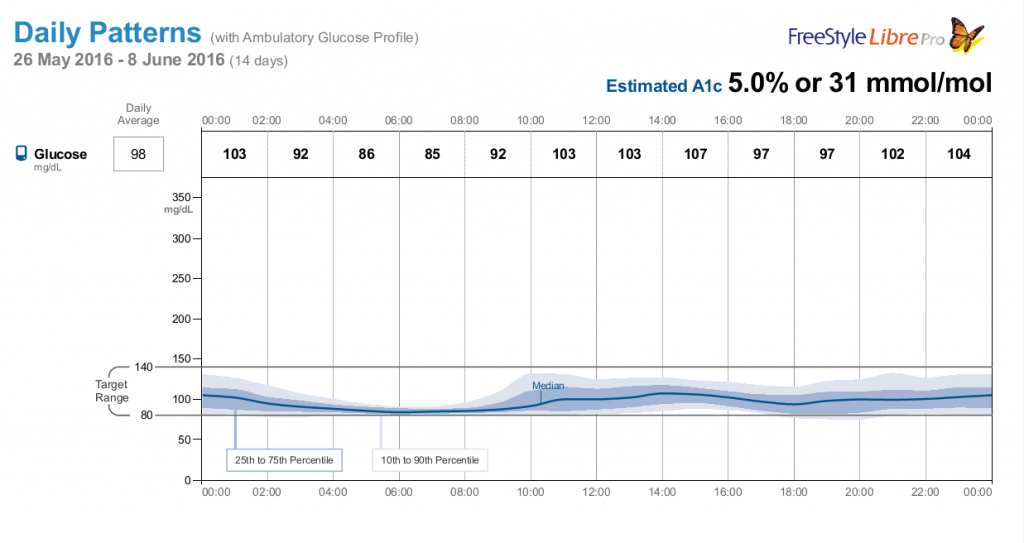
As per wikipedia, Ambulatory glucose profile (AGP) is an innovative methodology for interpreting a patient’s daily glucose patterns. AGP provides both graphic and quantitative characterizations of diurnal glucose patterns making it possible to identify previously undetectable abnormalities in glucose metabolism. First developed by Dr. Roger Mazze, in collaboration with colleagues at the Albert Einstein College of Medicine in 1987, AGP was initially used for representation of episodic self-monitored blood glucose (SMBG). In 2001, it was successful applied by Dr. Mazze to continuous glucose monitoring (CGM). In 2013, AGP analysis was applied to flash glucose monitoring (FGM) as a means of rapidly graphing glucose exposure, variability and stability, it has been used widely in diabetes research and clinical practice.
CGM of FGM (Flash Glucose Monitoring) data are plotted by time ignoring date and subjected to smoothing using five frequency percentile curves: 10th, 25th, 50th (median), 75th and 90th. The center (50th percentile curve) dark line represents overall glucose exposure (mean 98mg/dL).
Below you can find my Ambulatory glucose profile (AGP). Everything looks normal.
Ambulatory glucose profile (AGP)
The AGP shows significant variability indicated by the darkened area on either side of the median (25th-75th percentile curves–known as inter-quartile range or IQR). As you can see its quite narrow. The lighter area on either side of the IQR represents the inter-decile range within which 80% of all values will fall (the area between 10th to 90th percentile curves). The target range is between 80-140mg/dL.
Daily Patterns
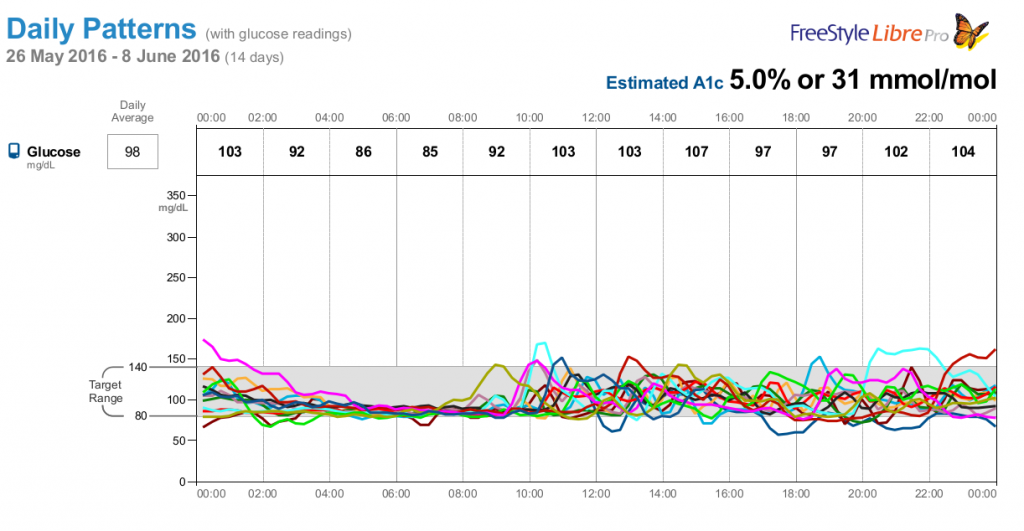
Hourly Pattern with glucose reading for every day at different time. Check late nights and early mornings, there seems to be a little rise.
Interesting Links
- Potential Health Development – Helped me to acquire the sensor. Contact them through their facebook page or website if you like to get one.
- Nightscout (CGM in the Cloud) is an open source, DIY project. FreeStyle Libre can be configured to work with Nightsout.
- Official app is called LibreLink, but there are other interesting apps provide your phone has NFC + Android 4.0 or greater, Like Glimp which can sync to Dropbox and Nightscout.
- My Trial: The Dexcom G4 CGM vs Freestyle Libre FGM
- Blogs: Diabetes Stories, Scott’s Diabetes
- Tidepool is an open source(GH), non-profit effort building an open data platform to reduce the burden of Type 1 Diabetes. Check their labs repository for interesting and new experiments.