Parsing and Visualizing Indian Flood Forecast
Flood forecast alerts are provided by Central Water Commission. They have boring maps and tables. Also they don’t provide data in program accessible format. Members of ICTD for asia are working on parsing and storing that data. In the meantime I wanted something to play. I found ScraperWiki (hacker news discussion) which can be used to scrape data from any page and schedule it for running. It allows php, python and ruby languages. Its easy and gives lot more flexibility than Y! pipes to scrape that data. Here is my scraper to get the flood data. You will have to register to get an API to use the data. Data is available in JSON, XML, PHP etc.

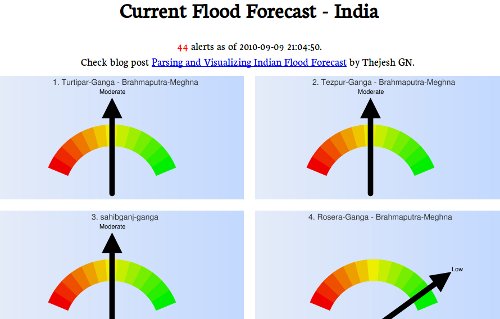
By the time I scraped the data, it was late. I couldn’t think so I used Google chart API to display simple dashboard. Probably tomorrow, I should be able to use the parsed data in a better way.
Anyway go ahead and have a look at finished Flood Forecast Alert System. Let me know your comments or creative ideas to visualize it.


This page is still way too much information.
I think names around the circle would have been better a visualisation of all the places.
@100rabh great idea. I will see how I can do that.
– How about displaying India rivers map and do image mapping and show the river-section in the flood level color – Like those satellite maps. – Would be difficult to implement, but easy for users to read.
– I doubt the accuracy of the data – There is red-alert over Dovaleswaram-Godavari in AP for severe flood forecast – but the pointer above shows Low.
Nevertheless, a good attempt for a social cause
May be a table with names on left and the forecasting (in the form of a horizontal bar) on right would help. You can even try to classify by states/rivers etc. with the help of a dropdown.