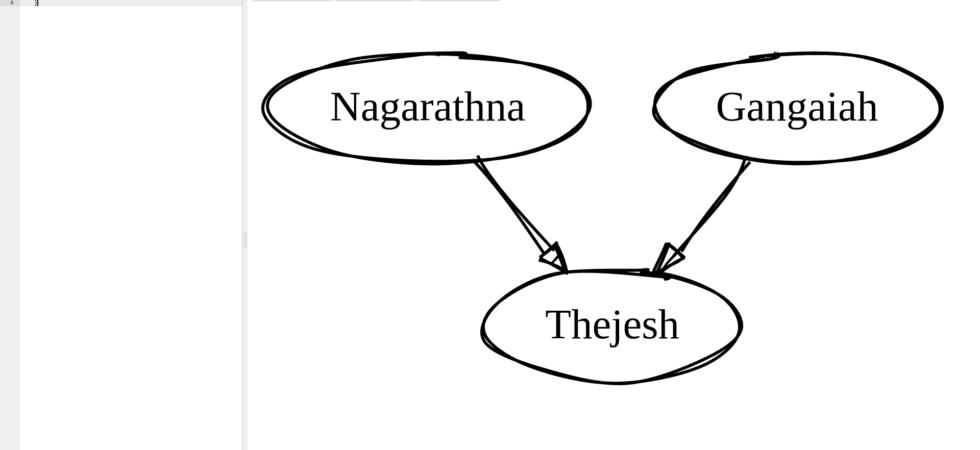
Drawings as Code – DOT and Graphviz
I like drawings to explain stuff. It’s probably the most straightforward way to document things. But the pain of traditional drawings is the inability to track changes to them. It’s easy to track changes to text or code by tracking them in a git. It’s not easy when it’s a binary blob which is what most images are. SVG format helps a lot. I use it as much as possible, but it’s still very verbose, and I think not easy to see the diff and understand what happened over time.


