Simple IMD Alerts
IMD (Indian Meteorological Department) has a district-level alert system. They give rain alerts for today and the next four days. They also have something called NowCast that shows the same alert level for now.
Alerts are basically four levels
- No Warning – Green
- Watch – Yellow
- Alert – Orange
- Warning – Red
Since it is district-level and not very specific, it might or may not be useful based on your use case. I find it useful when I am traveling.
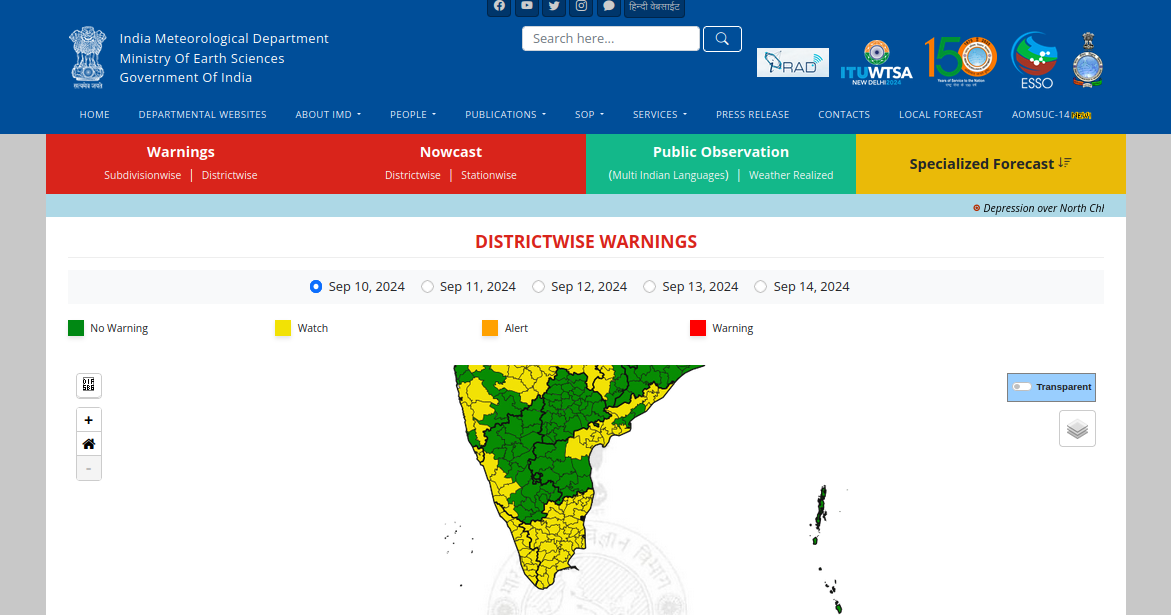
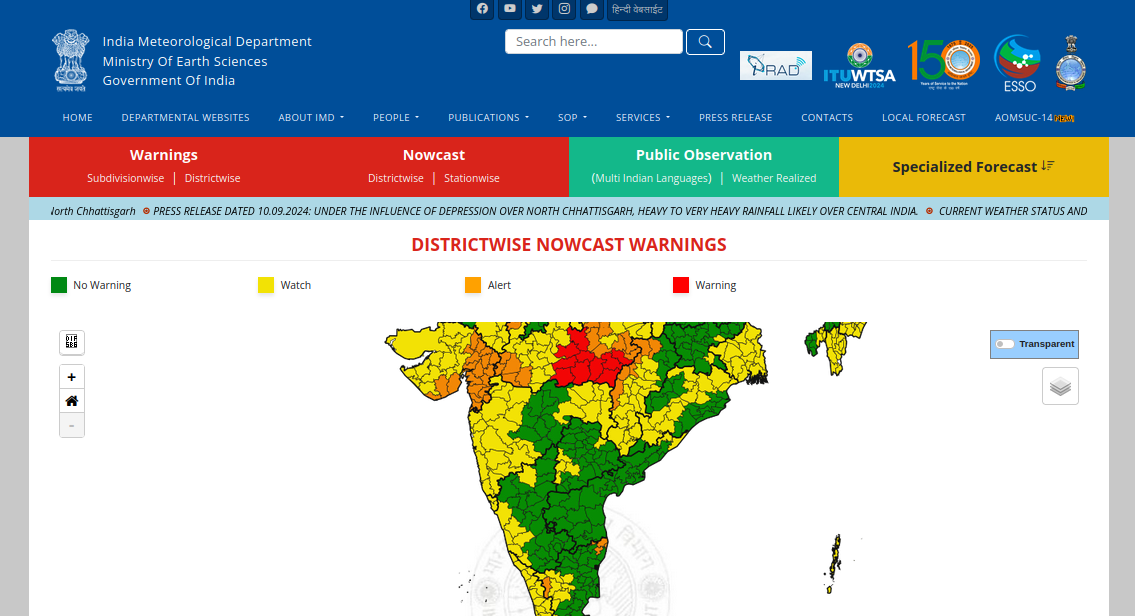
But there is no specific way to keep track of it or subscribe to it. You have to install their Android app or visit their website to get the details. Even there, there is no district-wise listing. All they have is a choropleth map showing you levels at the district level. I found it cumbersome, not so intuitive, and unnecessarily heavy for the information it provides.
What I want
I wanted a page showing the current and future warning levels given a location. So I got into exploring their maps. Their map is driven by a WMS layer, which serves the PNG tiles for bbox. So, if I craft my URL correctly, then I can just get one tile of the district that would give me warning levels. Since it’s a standard GIS server, I can get SVG instead of PNG. SVG is easy to explore programmatically in future. Since I am getting only one tile, it’s not heavy on the server, unlike loading their website and all the tiles.
IMD WMS Layer
Here are details of that layer for your exploration.
# WMS Layer for getting warning level

URL: https://reactjs.imd.gov.in/geoserver/imd/wms?env=day:Day1_Color
Layer: imd:Warnings_StateDistrict_Merged

# Note: You can add other parameters to URL part.
# env is the most important.

# Different env parameters for different days
env=day:Day1_Color  - For today
env=day:Day2_Color  - For Tomorrow i.e today + 1
env=day:Day3_Color  - For today + 2
env=day:Day4_Color  - For today + 3
env=day:Day5_Color  - For today + 4

# if you don't pass env variable then it will return the value for **now**.

# For a web based WMS url to get a tile,
# for a specific bbox will look like this.
# I have added line breaks for ease of reading

https://reactjs.imd.gov.in/geoserver/imd/wms?service=WMS
&request=GetMap
&layers=imd%3AWarnings_StateDistrict_Merged
&styles=
&format=image%2Fsvg
&transparent=true
&version=1.1.1
&env=day%3ADay1_Color
&width=256
&height=256
&srs=EPSG%3A4326
&bbox=76.20981195447168,10.523111,76.21896604552832,10.532111

# I plan to play with
- width and height
- bbox
- format
- env
My plan
- Take lat and lon as URL parameters
- Create a bbox of one square KM with the above as the center
- Make a request to their map server to get one particular tile
- Change the parameters to get different day values
- Create a page that shows these images as tiles
- Also, have a JSON output in case in the future I want to plugin it to HomeAssistant or alert system
Since I was trying val.town, I wrote that script in Javascript and deployed it immediately. It’s super easy and quick to iterate on val.town. I love how easy it is to build small apps.
It can produce an HTML web page and JSON. I have also added the code to GitHub gist as a backup. It supports the following URL parameters
- lat = latitude, default is Bengaluru’s
- lon = longitude, default is Bengaluru’s
- format = html or json, default is html
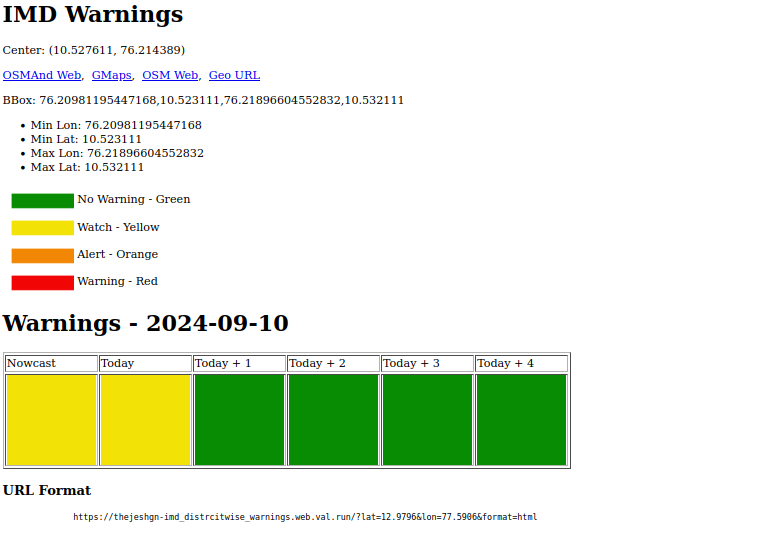
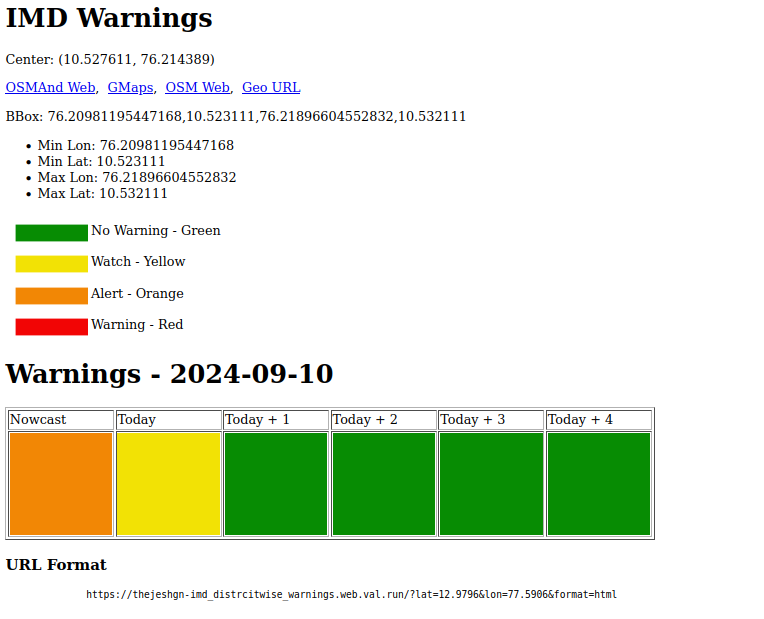
Example pages
- Bangalore, KA https://thejeshgn-imd_distrcitwise_warnings.web.val.run/?lat=12.9796&lon=77.5906
- Thrissur, KL https://thejeshgn-imd_distrcitwise_warnings.web.val.run/?lat=10.527611&lon=76.214389
- Lalitpur, UP https://thejeshgn-imd_distrcitwise_warnings.web.val.run/?lat=24.6936599&lon=78.412621
- Vishisha, MP https://thejeshgn-imd_distrcitwise_warnings.web.val.run/?lat=23.5210259&lon=77.809569
Future improvements
- Maybe cache everything except NowCast, further reducing the load on the upstream server. It’s already very, very low. Saving also helps us to analyze data later.
- Currently, I am returning a small SVG and not the actual warning level value. I want to return textual values like green, yellow, orange, and red instead of image. I am not sure how to do that. One possible way is to extract the fill color from the SVG. The textual value will make it possible to plug into alerting systems, making it instantly more helpful. It will also make it a proper API.
- Provide a GEOJSON feed version ( format=geojson) of the API


Very nice Thej, a documented public API for this is very much needed.
IMD also has this data on their WFS server[1] and which is used to render the map on their Nowcast page[2]. This endpoint could also be useful for fetching in an easy to parse format.
[1] https://reactjs.imd.gov.in/geoserver/wfs?callback=getJson&service=WFS&version=1.1.0&request=GetFeature&typename=imd%3Adistrict_warnings_india&srsname=EPSG%3A4326&format_options=callback%3AgetJson&outputFormat=text%2Fjavascript&_=1726038102506
[2] https://mausam.imd.gov.in/responsive/districtWiseWarningGIS.php
Thank you. I will have a look.