Tagged: Open Data

Public CCTV Camera at Cubbon Park, By Yashodhara Udupa 0

Surveillance in Bengaluru – Updates

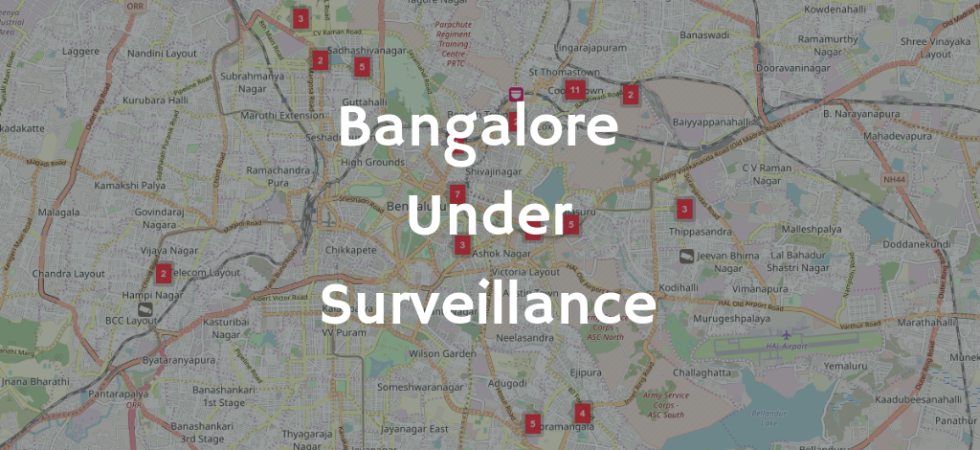
I have been mapping Surveillance in Bengaluru for couple of months now. We have made some good progress. I thought it’s good time to share those updates and ask for help. Mapping We have mapped 340 Public and Outdoors CCTV cameras. I think we have made good progress. But to cover the entire...

HOPCOMS API 0

Updates to HOPCOMS API

HOPCOMS Daily rate page moved to a new location last month. It’s not visible on Google search and hence I couldn’t find. But a good soul at HOPCOMS whom I got in touch with sent me this new link. It’s not just change of url. They have changed the structure of the data...

10

Mapping Surveillance in Bangalore using OpenStreetMap

For last couple of months I have been driving quite a bit inside the city1. The biggest thing I noticed was the amount of public CCTV cameras across the city. I find them in every corner. We don’t know clearly how many of them are there, what’s the spread, who owns them and...

0

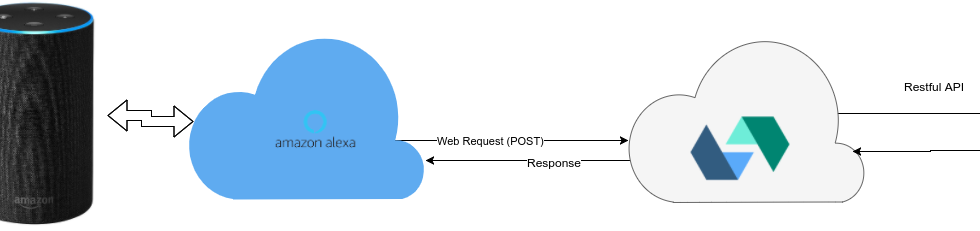
Building an Alexa Skill using OpenWhisk and CouchDB

Smart Speakers are becoming popular these days. I see Alexa or Google home everywhere, Voice is an interesting technology and I think it’s going to become very popular amongst younger and elderly community. Here in this tutorial we will create a simple Alexa Skill using OpenWhisk as our serverless platform and CouchDB as our database.

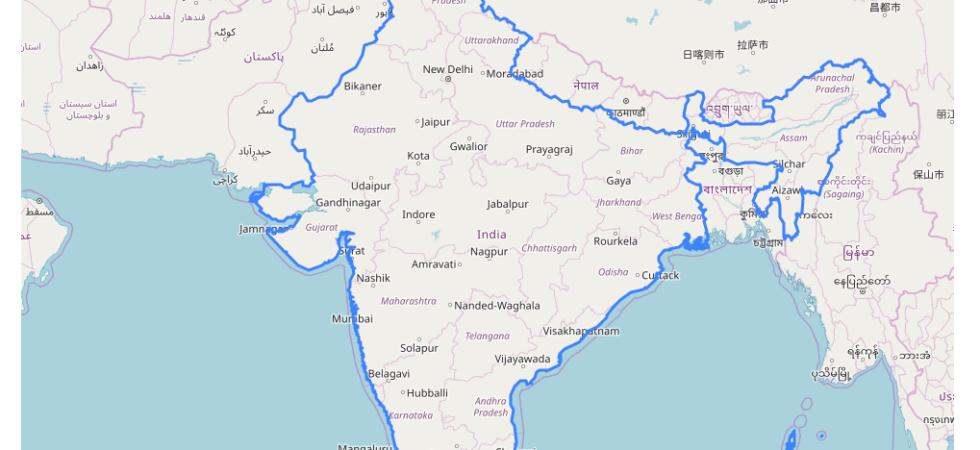
Official External boundaries of India Provided by Survey of India. 0

Download Official External boundaries of India by Survey of India

For a long time the Indian OpenStreetMap community and DataMeet Community was looking for an official external boundaries. Even-though the commercial counter parts had it, the community didn’t have access to it. That status has changed now. Now we have the official external boundaries of India by Survey of India out in public...

Line graph of PM 2.5 0

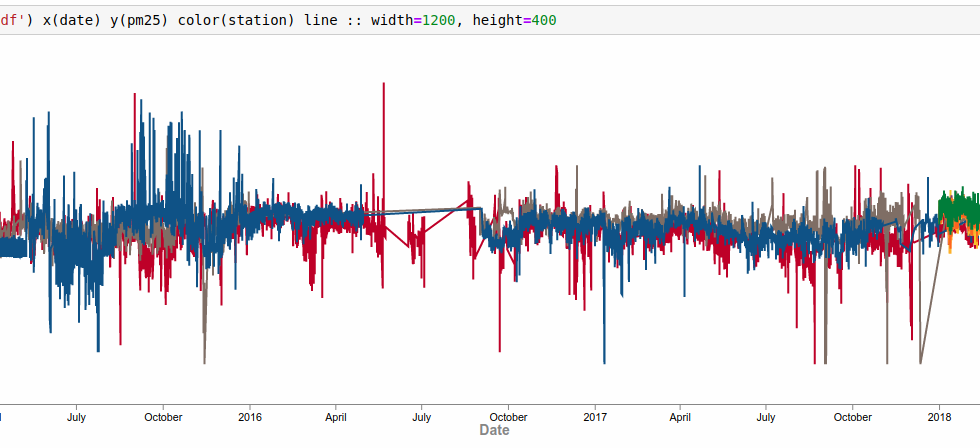
Visualizing Air pollution in Bangalore using Brunel

Brunel defines a highly succinct and novel language that defines interactive data visualizations based on tabular data. Brunel is Visualization language. It’s a domain specific language. It has its own grammar. It feels familiar to anyone who thinks in data and want to visualize it. Brunel is also open source and works well...