Log Analyzer for Log4j – Chainsaw
We have been using the Log4j for logging since years. Log4j is pretty matured. The log4j developers add something new every time they release a version.Now Log4j has the capability of logging into anything and everything. You can log the events in to file system ( simple or xml) or database on JDBC or socket or smtp. Most of the time we use the simple rolling file logging. Which logs events into a text file and rolls up depending on the condition.
Log4j has an option of switching off the levels when you deploy to production servers. But when you are on test servers and incase there are multiple testers testing your web application you would want all the levels ON. In such cases the log of a web application can eaily cross hundreds of megs and its difficult to monitor. The developers at apache have something for you to ease your work.
Chainsaw v2 is a companion application to Log4j written by members of the Log4j development community. Like a number of Open Source projects, this new version was built upon inspirations, ideas and creations of others. Chainsaw v2 has it's roots from the original Chainsaw utility written by Oliver Burn, and with inspiration from the Log Factor 5 utility contributed by ThoughtWorks Inc.
You need to play around with this tool to know more. If your application already has a text log and you want to monitor it. Here is an how to for it ( I have used unix/dos stand alone version) 1. Create a configuration XML
<?xml version="1.0" encoding="UTF-8" ?>
<!DOCTYPE log4j:configuration >
<log4j:configuration xmlns:log4j="http://jakarta.apache.org/log4j/" debug="true">
<plugin name="logfile"
class="org.apache.log4j.varia.LogFilePatternReceiver">
    <param name="timestampFormat" value="yyyy"/>
    <param name="logFormat" value="TIMESTAMP LEVEL CLASS MESSAGE"/>
    <param name="fileURL" value="file:///C:/myapp/mylog.log"/>
    <param name="tailing" value="true"/>
</plugin >
<root><level value="debug"/></root>
</log4j:configuration>
where
timestampFormat = is the format of the time stamp in the logfile
logFormat= is your actual log format
fileURL= your log file url
tailing= you want continuous monitoring. Required when you want to do live monitoring.
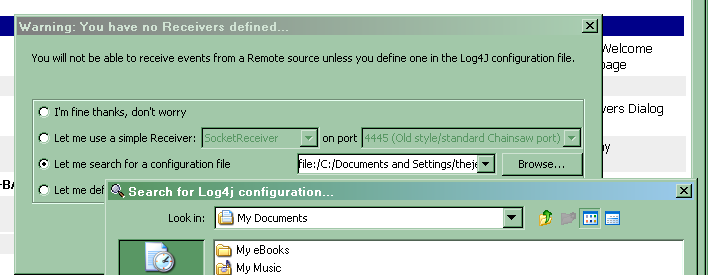
2. Start the application. Choose the third radio on it and give the path of the xml
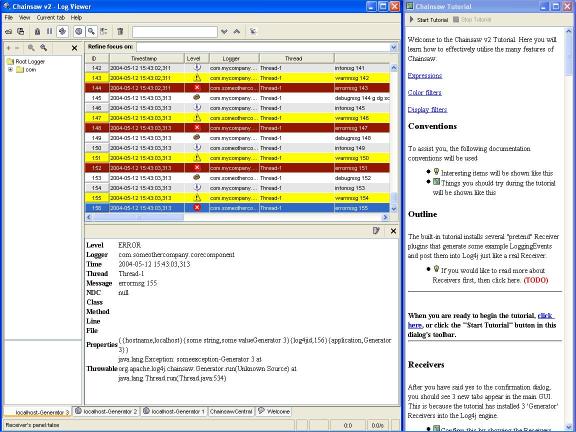
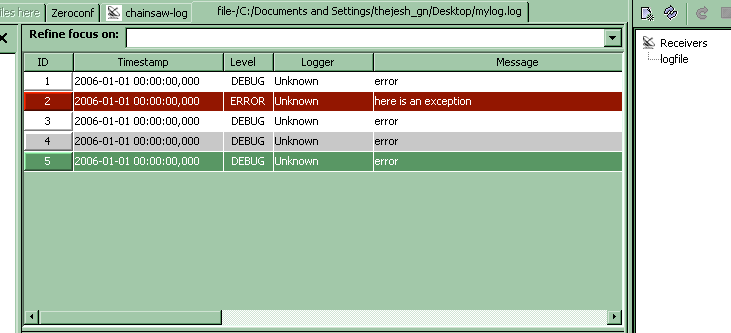
3. voila. You can see the log statements as tabs with color coding. click on the tab to see the log details below.
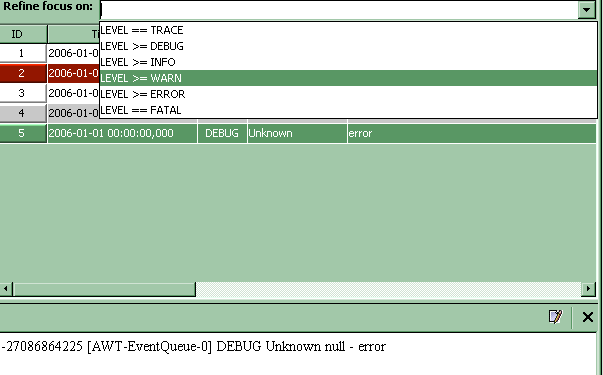
4.You can filter the statements too.
Heres just a brief run down of some of the features of Chainsaw v2 mentioned on their site
- View remote events - Remote events are "received" by Chainsaw using Log4j 1.3's new Receiver concept.
- Saved Preferences - You can fully customize each Tab the way you want it, and it will restore it's state the next time.
- Responsive - When events are screaming in, you don't want the GUI to meltdown. You can control how responsive the GUI is and determine the frequency of updates.
- Tabs/Docking - Chainsaw routes separate applications/remote hosts' events to a unique Tab within the GUI. These tabs can be undocked from the main window. Using these features you can manage multiple application logs using the one GUI.
- Coloring - You can specify your own rules to color each event row depending on the attributes of a LoggingEvent to help you locate important events.
- Dynamic and powerful filtering - Helps you locate stuff. There's support for quick-and-dirty filtering, right through to advanced expression-based filtering (e.g. "LOGGER == 'com.mycompany' && LEVEL == ERROR" ).
- Cyclic - A tab view can support a Cyclic-based model, which constrains it's view to the last X events, ensuring you don't hog memory. This is great for monitoring live applications.
- Built-in documentation and tutorial - HTML-based documentation included in the package.