How I built A Quick Dashboard for #SpeakForMe Campaign
#SpeakForMe is a campaign to petition Indian MPs, Banks, Mobile operators and other service providers to speak for you against the Aadhaar linking coercion. You can go to #SpeakForMe to send your petition. As part of campaign I built a quick and dirty dashboard for the emails sent. This is a quick note on how I did that.
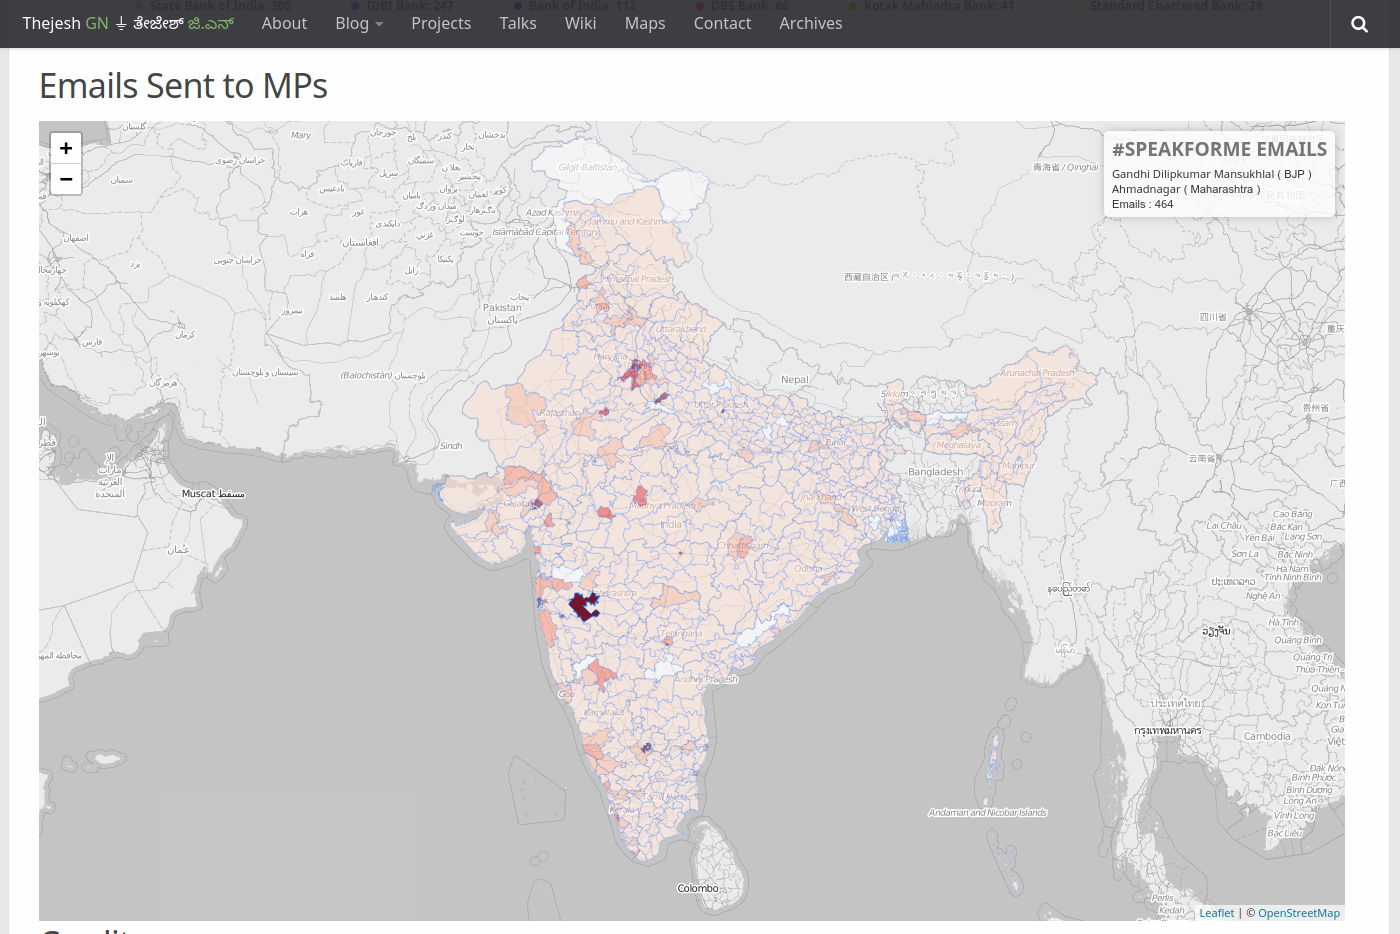
Part of #SpeakForMe dashboard showing emails sent to MPs on a PC map.
#SpeakForMe has a twitter account @bulletinbabu which used to tweet updates in a standard format, at regular intervals. At first I started parsing these tweets and started plotting them on a graph. The parsing script would run every hour find all the tweets and then parse them and insert them into a CouchDB. Parsed CouchDB document is very simple and can be used to directly for charting
{
   "_id":"2017-12-13T18:20:02+05:30",
   "_rev":"1-67c8a405a19f3a787f42640fa1ac9aef",
   "govt":32,
   "stat":"email_sent",
   "mps":780,
   "campaign":"#SpeakForMe",
   "others":13,
   "mobile":69,
   "tw":940926800292540417,
   "total":1000,
   "banks":106
}
Scraper code is pretty standard too
#!/usr/bin/env python
# encoding: utf-8
import couchdb
import tweepy #https://github.com/tweepy/tweepy
import csv
import re
import arrow
import time

# The consumer keys can be found on your application's Details
# page located at https://dev.twitter.com/apps (under "OAuth settings")
consumer_key=""
consumer_secret=""

# The access tokens can be found on your applications's Details
# page located at https://dev.twitter.com/apps (located
# under "Your access token")
access_key=""
access_secret=""

#you will have to change this
couch_url = "https://username:password@mycouchdb.url.com"

remote_server = couchdb.Server(couch_url)
bulletinbabu_db = remote_server['bulletinbabu']

def get_all_tweets(screen_name):
	#Twitter only allows access to a users most recent 3240 tweets with this method

	#authorize twitter, initialize tweepy
	auth = tweepy.OAuthHandler(consumer_key, consumer_secret)
	auth.set_access_token(access_key, access_secret)
	api = tweepy.API(auth)

	#initialize a list to hold all the tweepy Tweets
	alltweets = []

	#make initial request for most recent tweets (200 is the maximum allowed count)
	new_tweets = api.user_timeline(screen_name = screen_name,count=200,tweet_mode="extended")

	#save most recent tweets
	alltweets.extend(new_tweets)

	#save the id of the oldest tweet less one
	oldest = alltweets[-1].id - 1

	#keep grabbing tweets until there are no tweets left to grab
	while len(new_tweets) > 0:
		break

		#all subsiquent requests use the max_id param to prevent duplicates
		new_tweets = api.user_timeline(screen_name = screen_name,count=200,max_id=oldest,tweet_mode="extended")

		#save most recent tweets
		alltweets.extend(new_tweets)

		#update the id of the oldest tweet less one
		oldest = alltweets[-1].id - 1

		print "...%s tweets downloaded so far" % (len(alltweets))


	for tweet in alltweets:
		print "--------------------------------------------------------------------------------------------"
		bulletinbabu = {}
		bulletinbabu['tw']=tweet.id
		bulletinbabu['campaign']="#SpeakForMe"
		bulletinbabu['_id'] = arrow.get(tweet.created_at).to('local').format('YYYY-MM-DDTHH:mm:ssZZ')
		text =  tweet.full_text.encode("utf-8")
		print str(text)
		if text.startswith("Emails from #SpeakForMe to:"):
			bulletinbabu['stat']="email_sent"
			regex_search = re.search('MPs:(.*) ', text, re.IGNORECASE)
			if regex_search:
				mps = regex_search.group(1)
				mps = mps.replace(",","")
				print str(mps)
				bulletinbabu['mps']=int(mps.strip())

			regex_search = re.search('Banks:(.*) ', text, re.IGNORECASE)
			if regex_search:
				banks = regex_search.group(1)
				banks = banks.replace(",","")
				bulletinbabu['banks']=int(banks.strip())

			regex_search = re.search('Mobile service providers:(.*)\ ', text, re.IGNORECASE)
			if regex_search:
				mobile = regex_search.group(1)
				mobile = mobile.replace(",","")
				bulletinbabu['mobile']=int(mobile.strip())

			regex_search = re.search('Government services:(.*)\ ', text, re.IGNORECASE)
			if regex_search:
				govt = regex_search.group(1)
				govt = govt.replace(",","")
				bulletinbabu['govt']=int(govt.strip())

			regex_search = re.search('Others:(.*)\ ', text, re.IGNORECASE)
			if regex_search:
				others = regex_search.group(1)
				others = others.replace(",","")
				bulletinbabu['others']=int(others.strip())

			regex_search = re.search('Total:(.*)\ ', text, re.IGNORECASE)
			if regex_search:
				total = regex_search.group(1)
				total = total.replace(",","")
				bulletinbabu['total']=int(total.strip())
			print str(bulletinbabu)
			try:
				bulletinbabu_db.save(bulletinbabu)
			except couchdb.http.ResourceConflict:
				print "Already exists"
				break
			time.sleep(0.1)
		elif text.startswith("Top recipients of #SpeakForMe emails:"):
			#bulletinbabu['stat']="top_rcpt"
			pass


if __name__ == '__main__':
	#pass in the username of the account you want to download
	get_all_tweets("bulletinbabu")
Since CouchDB provides http restful access to data, there was no issue in pulling the data from the database using standard AJAX requests for plotting. Couple of days later #SpeakForMe team wanted to see how many emails were sent to MPs. So I asked them to post the aggregate analytics 1 they were collecting to my CouchDB. They started posting two types of documents. One aggregate at services level, second aggregates at individual receiver level. Posting would be a simple web POST using python requests for them. Just like posting to any webhook
import requests
couch_url = "https://username:password@mycouchdb.url.com"
data = {'stat': 'email_sent', 'total':2339 , 'campaign': '#SpeakForMe', 'mobile':198 , 'tw':941038005199998978 , 'govt':78 , 'mps': 1824, 'others':6 , 'banks': 233, '_id': u'2017-12-14T01:41:00+05:30'}
r = requests.post(couch_url, json = data)
First document is similar to what I used to scrape. Second one is a bigger document. It has number of emails at the level of service provider or MP. Attribute “stat” differentiates the two types of document. _id which is primary key is just a standard time-stamp. As you can see in the partial “mailbox_email_sent” document below. The key has two parts “type of provider” and “provider name”, separated by “/”. For airtel it is “mobile/airtel” etc. For mps it starts with mp and then has state code and parliamentary constituency number, Eg: “mp/mh-47”. Here is the copy of full document if you like to see.
{
   "_id":"2017-12-20T13:10:03.243684+05:30",
   "_rev":"1-b9ed7d5104bf0c8e1fbd341743829084",
   "gov/pan":344,
   "mobile/mts":1,
   "mp/ar-2":4,
   "mp/mh-47":28,
   "bank/bkid":24,
   "mp/ka-14":19,
   "mp/ka-15":65,
   "mp/wb-41":1,
   "campaign":"#SpeakForMe",
   "bank/orbc":10,
   "mp/ke-20":167,
   "total":32354,
   "bank/lavb":2,
   "bank/synb":6,
   "bank/ibkl":19,
   "mobile/airtel":595,
   ...
   ....
   ...
   "mp/or-12":4,
   "mp/pb-8":17,
   "mp/wb-30":5,
   "bank/indb":14,
   "mobile/idea":183,
   "stat":"mailbox_email_sent",
   "bank/vijb":7,
   "mp/bi-38":18,
   "mp/bi-40":3
}
On the client side its just static html and javascript. I used Parliamentary Constituencies Maps provided by Data{Meet} Community Maps Project. They are displayed using leaflet and d3. In fact I borrowed parts of code from DataMeet maps project. I use Lodash, to query, filter and manipulate the documents returned by CouchDB. For example
let all_rows = _.reverse(returned_data.rows);
//Filter emails sent
let rows =  _.filter(all_rows, function(o) { return o.doc.stat == "email_sent" && o.doc.campaign == "#SpeakForMe"});
let latest_row = _.last(rows);

let rows_mailbox_email_sent = _.filter(all_rows, function(o) { return o.doc.stat == "mailbox_email_sent" && o.doc.campaign == "#SpeakForMe"});
let latest_mailbox_email_sent = _.last(rows_mailbox_email_sent);
You can see the code that does everything here. I used Frappé Charts for charting. I love them. They are simple and look great.
Basically analytics data gets stored in a CouchDB and served as standard restful that CouchDB provides to browser. Running couchdb to receive external authenticated webhook post and then serve the data as restful service worked like a charm. Of course I didn’t have much traffic to test under load. But since CouchDB is behind a CloudFront (Amazon CDN), I guess is it can take quite a bit of load. Usually the team pushes data every 5 minutes if there are updates. So it shows live status (see the last updated time stamp).
At some point I will create graph of email traffic (daily emails sent etc). Any other graphs you would like to see? I will be happy to answer any questions if you have.
- As you can see in the data json documents, only aggregates, no personal information ↩