How to create Sparklines in LibreOffice Calc
I love using sparklines. I use them everywhere from Google Sheets to web pages. Popularized by Edward Tufte. It's usually a small line chart without axes or coordinates. Like this . I like them because they go very well with text, without disturbing the flow but significantly adding to the information display.
Sparklines are small, intense, word-sized graphics with typographic resolution. Sparklines are can be placed anywhere that words or numbers or graphics can be placed: in sentences, maps, graphics, tables. Sparklines have a data-ink or data- pixel ratio = 1.0, consisting entirely of data, with no non-data at all. Thus sparklines have no frames, tic marks, and non-data paraphernalia. Sparklines often get their quantitative scaling context from nearby words, numbers and graphics; sparklines are directly quantified by numbers on or near the sparkline itself.
On web I use jQuery.sparline. It's easy to work with and offers different formats as well. I am also looking for simple SVG/Canvas based ones but as of now this jQuery plugin works really well.
One Google sheets I use builtin SPARKLINES function. Excel also has a similar function. But I am LibreOffice user. LibreOffice calc doesn't have SPARKLINES function. Hence this post. My first step was to search for a LibreOffice addon. There seems to be one but it's not maintained and doesn't work anymore, hence I am not linking.
My next step was to create one, but writing and maintaining one takes significant effort. Hence I started looking for hacks. My first idea was to use this very creative way of building SVG sparklines, where JavaScript embeded inside SVG reads the parameters and creates the actual image dynamically. It's a great idea. But I was looking for something that can be used across the platforms1 and I chanced upon Sparks project by After the Flood. In simple words sparks is a font that you can apply to a set of data, which renders data as sparklines. The data needs to be formatted as comma-separated values, with curly brackets at both ends of the dataset, Eg: {1,2,3}. When you apply Sparks font, text {1,2,3}, becomes a sparkline. It's as simple as that. Sparks has fifteen styles (fonts), that will allow you to design your sparkline the way you want. Since it's just a font, you can use CSS to style it as well.
Since Sparks was just a font, I imagined it would work wherever it's installed. This made me to use it inside LibreOffice calc and it worked beautifully. Below I have documented steps and scripts, that I use. It's probably useful to you too.
Install Font
As a first step let's download and install the Sparks font. The zip file will have around 15 fonts. I installed all the fonts. I installed OTFs. Once you install these fonts. You should be able to see them in the Fonts drop down inside your LibreOffice Calc, Txt or Impress.
Write a Macro Function
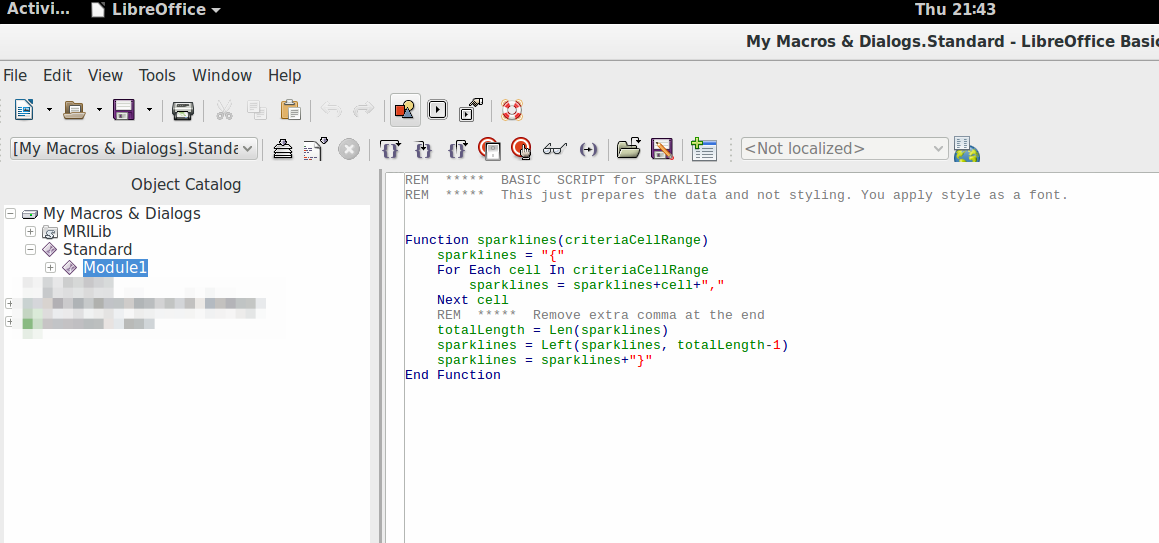
Now in LibreOffice calc, We will create a function called SPARKLINE This function format the data as per Sparks requirement. Go to Tools- Macros - Organize macros - LibreOffice Basic . Create a new module and add the following code. Save it and close the macro editing dialog.
REM  *****  BASIC  SCRIPT for SPARKLIES
REM  *****  This just prepares the data and not styling. You apply style as a font.
Function sparklines(criteriaCellRange)
	sparklines = "{"
	For Each cell In criteriaCellRange
		sparklines = sparklines+cell+","
    Next cell
    REM  *****  Remove extra comma at the end
    totalLength = Len(sparklines)
    sparklines = Left(sparklines, totalLength-1)
	sparklines = sparklines+"}"
End Function
Logic inside the function is straight forward. It takes a range of cells, arranges them as comma separated values. It also adds flower brackets at the beginning and at the end. And returns that string.
Insert and Style Sparkline
Now our macro will be available as a function SPARKLINE. You can use it just like any other function. It expects a range of cells that has data. So for example you can insert =SPARKLINE(j1:j10) into a cell, assuming cells j1 to j10 have data.
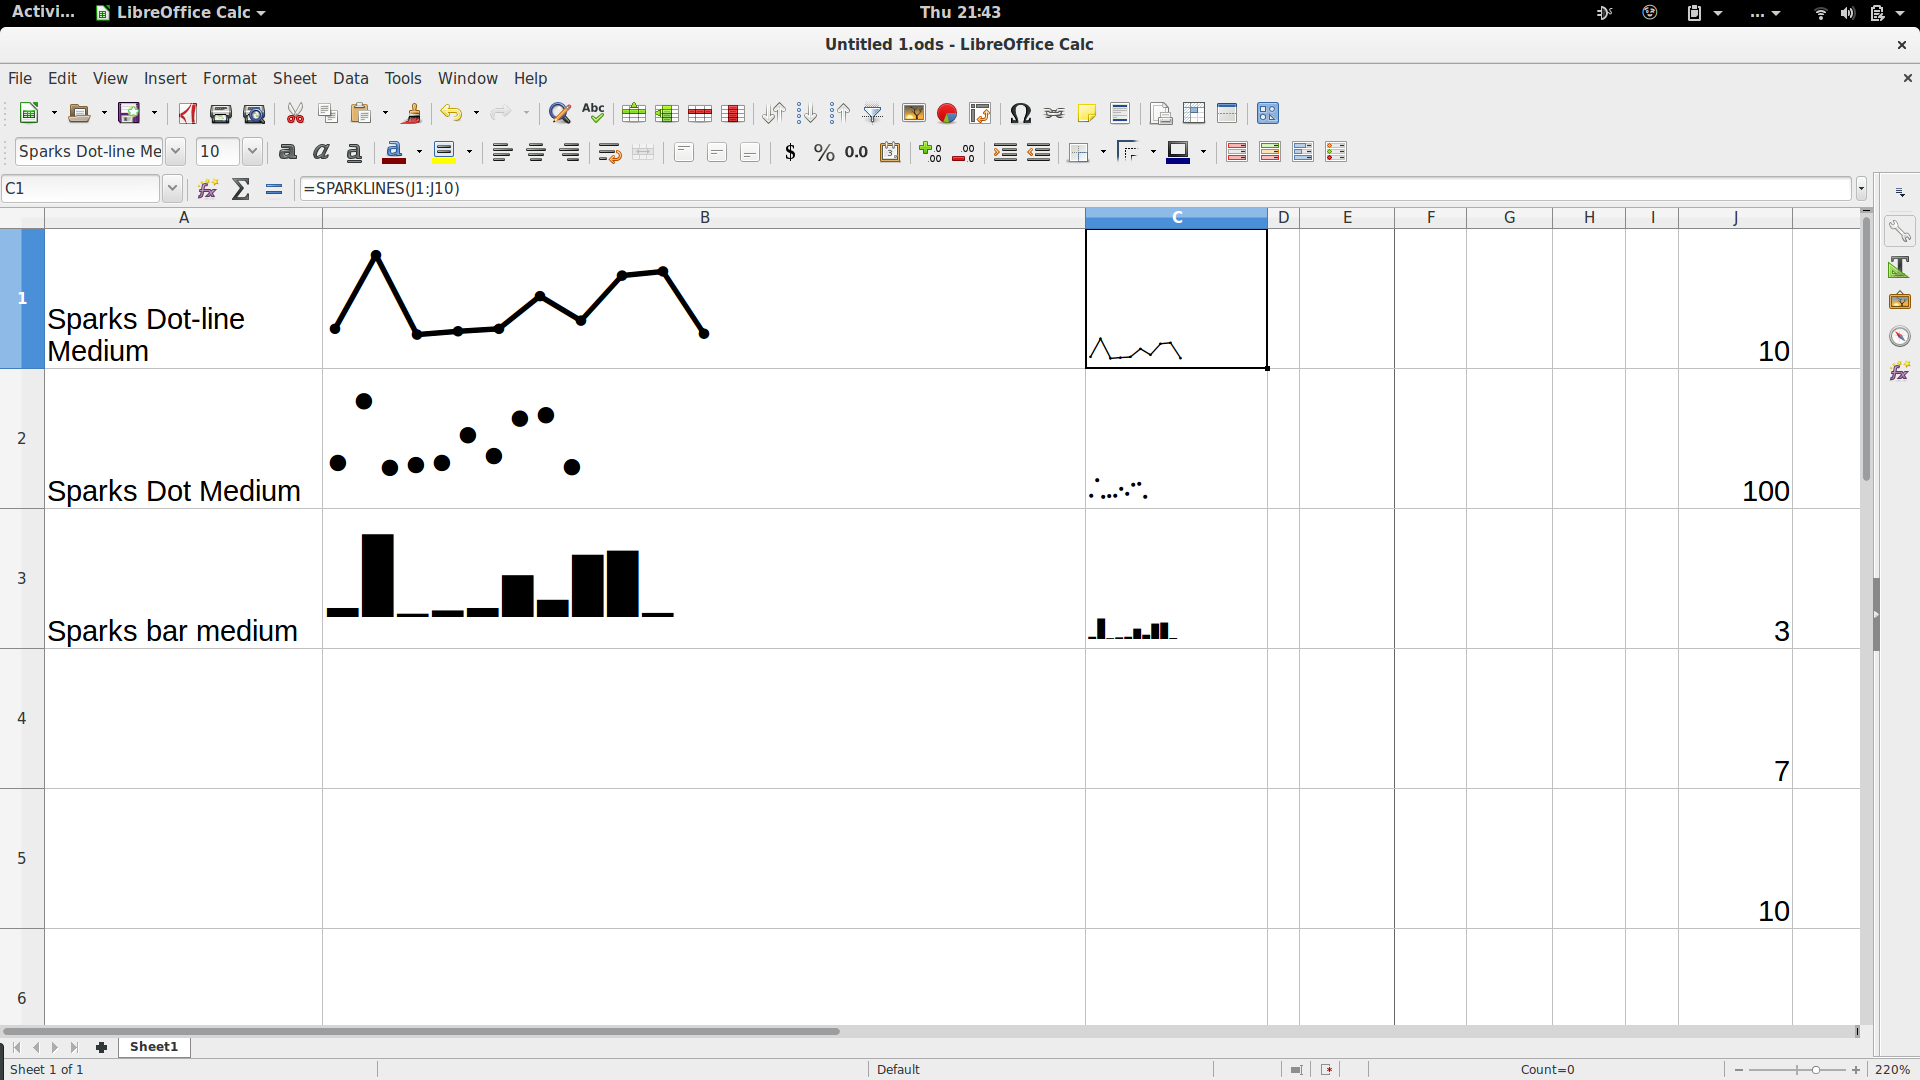
Now change the Font of the cell to one of the Sparks fonts. Voila, you should be able to see a Sparkline. A different Sparks font gives you different type of sparkline. You can also use font color, size etc to style the line.
Ship it
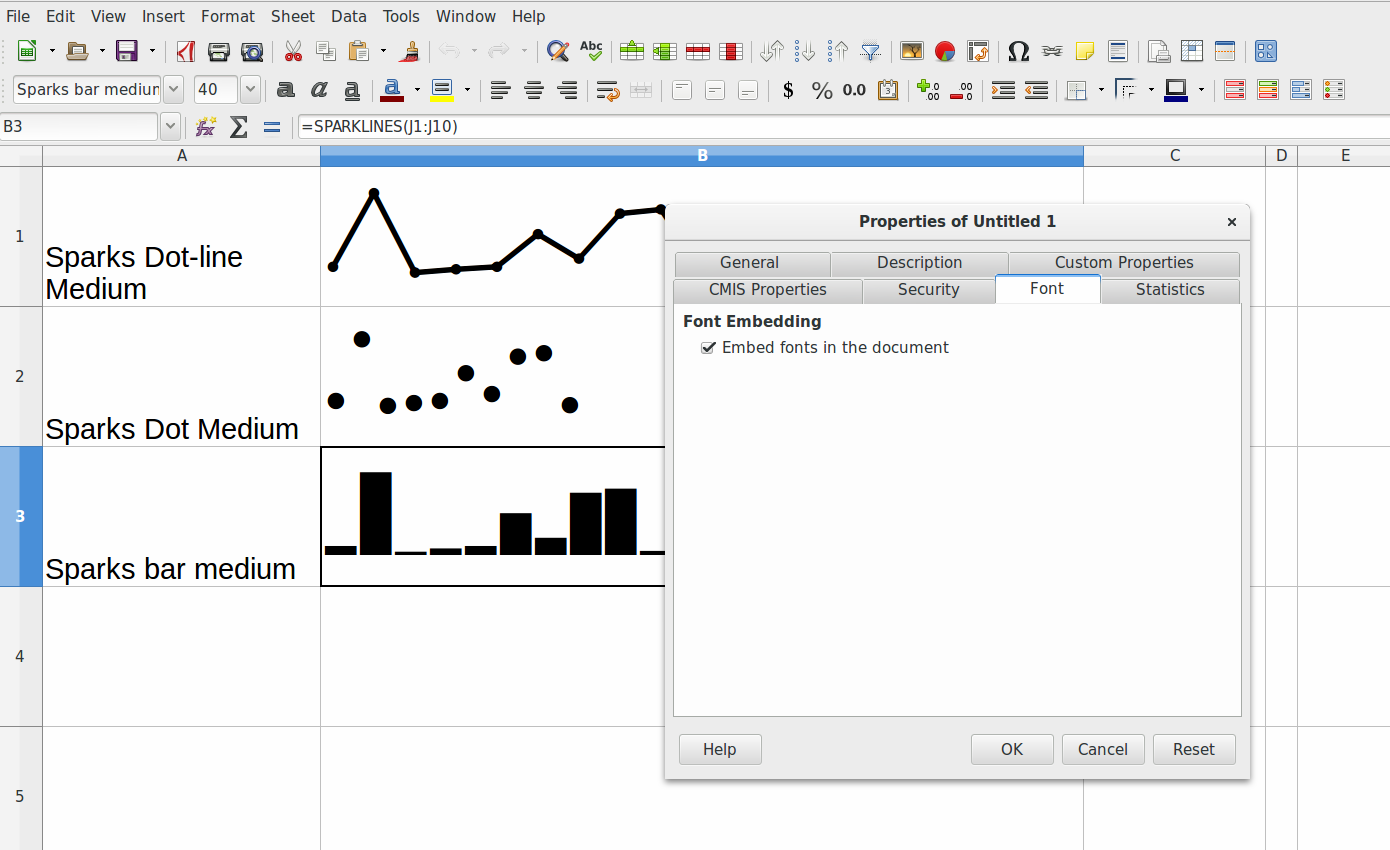
For shipping, you need to embed both the Macro and Font inside the sheet. The enduser needs to enable to Macros to view it. To embed font Go to File -> Properties -> Font.
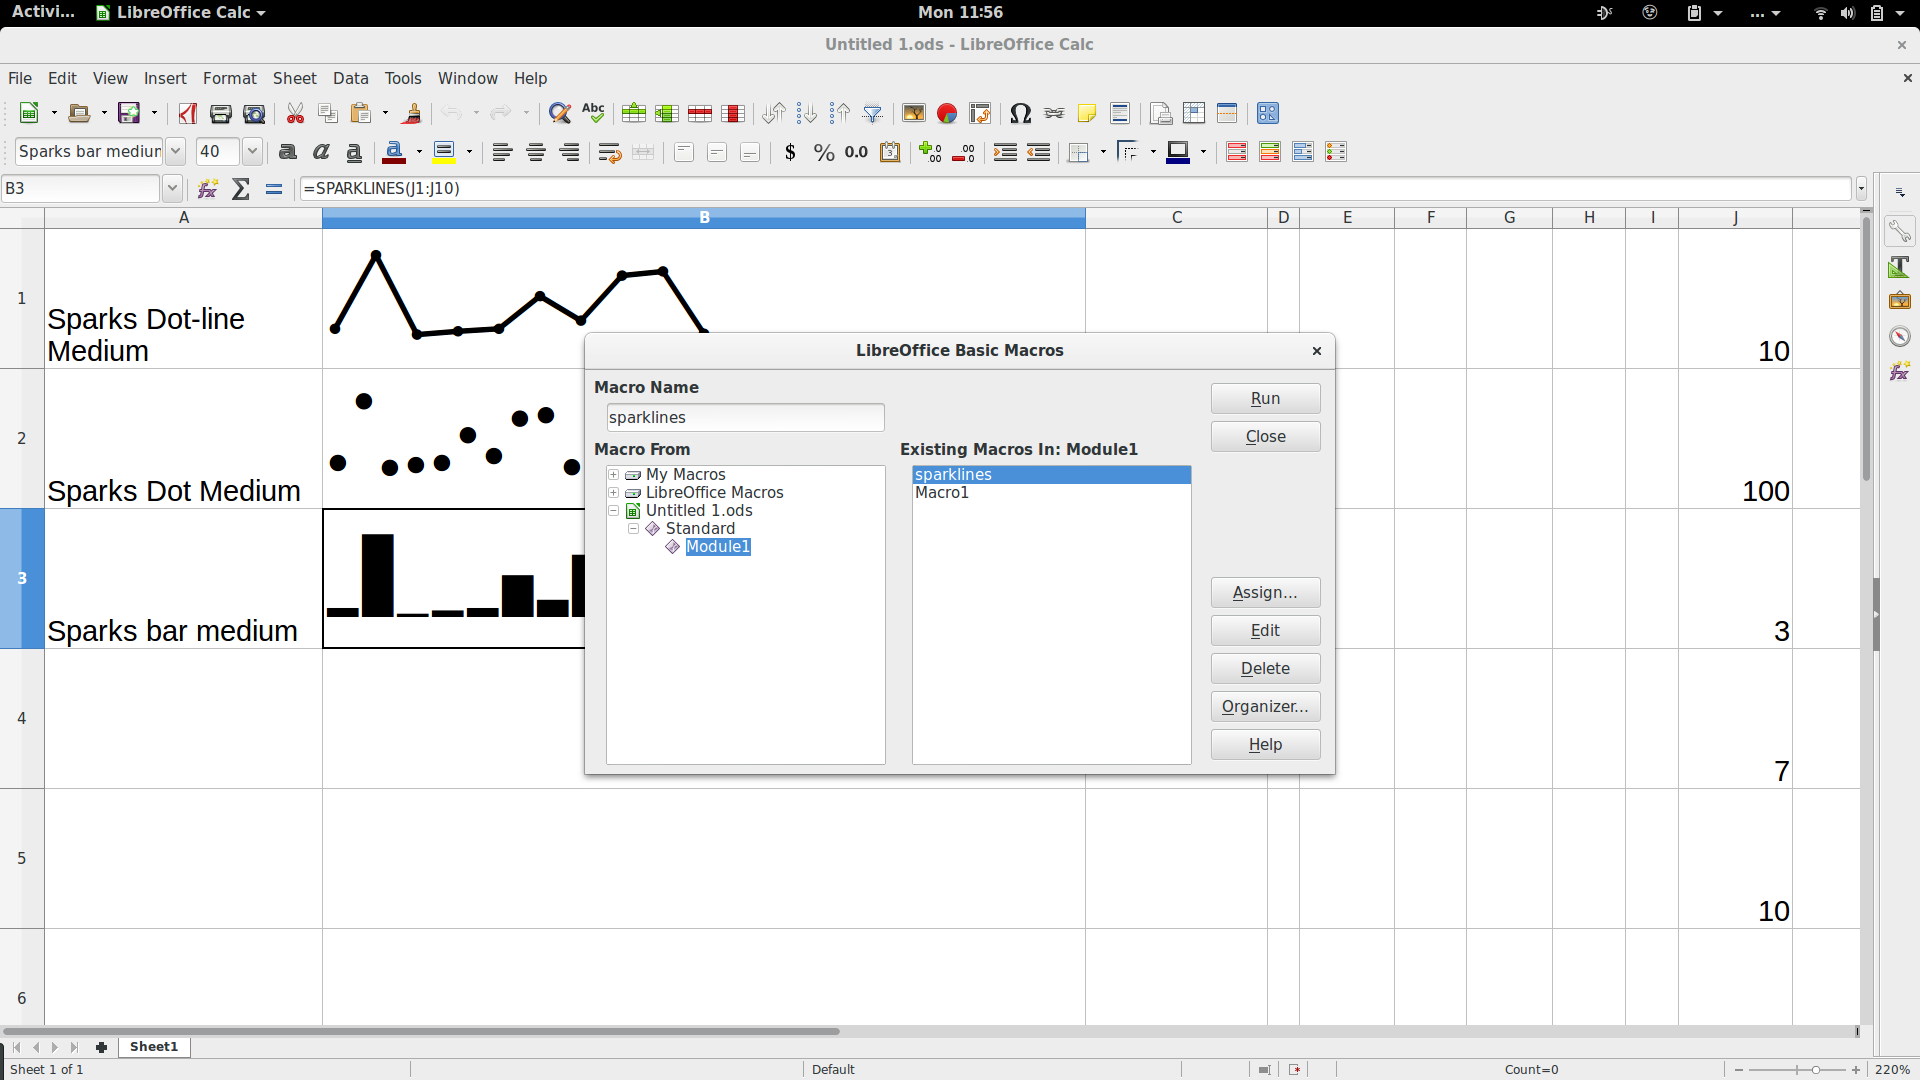
For embedding Macro. Move the macro module from My macros - 'Standard' Library to You Documents 'Standard' Library. Save the document. Now the Macro is inside your document.
What do you think? Is this useful? Do you have any other ways of inserting sparklines in LibreOffice?
- I am till very excited by this SVG sparkline. I am going to hack around. ↩


Thanks for the information. I am using this now in LibreOffice Calc. Is there a way to deal with decimal values using the Sparks font? It seems to only work with integer values.
Hello,
just modify : cell ->int(cell)
sparklines = sparklines+int(cell)+”,”
I am having trouble with values over 100.
– less than or equal to 100 –> graphs normally
– if the value is > 100 and the 10s place is 0 (ex 105) –> types “10” before graph of single digit height
– if the value is > 100 and the 10s place is not 0 (ex 115) –> types “1” before graph of double digit height
– negative values –> print “-” before graph
– if the out of range value is the first in the list –> also prints curly brace before number
I hope I explained it well enough. Is there a way to fix this so it prints all ranges of integers
Thanks
I had the same problem – it’s to do with the fonts. I modified the macro to scale the numbers. Here’s my version of the code…
Function sparkline(CellRange)
dim mincell as integer, maxcell as integer
dim celloffset as integer, cellscale as double
dim x as string
x = “”
mincell = 1000000
maxcell = -1000000
For Each cell In CellRange
if cell > maxcell then maxcell = cell
if cell = 0 and mincell = 0 and maxcell
celloffset = 0
cellscale = 1
else
celloffset = -mincell
cellscale = (maxcell – mincell) / 100
endif
For Each cell In CellRange
x = x + int((cell + celloffset) / cellscale) + “,”
Next cell
sparkline = “{” + Left(x, Len(x) – 1) + “}”
End Function
Hope that helps