Building Surveillance in Bangalore leaderboard using Budibase and CouchDB
I wanted to convert the script from the blog post Who is mapping Surveillance in Bengaluru into a simple web app. I could have written a simple JavaScript and HTML code to call the overpass-turbo API for data and charted using JavaScript. All in the browser. But there was a much better option with less code.
Please note that I have rebuilt the leaderboard using Node-Red and CouchDB, which is the current implementation. Please refer to that.
I was exploring Budibase for building some simple apps. Since Budibase supports REST API calls. I thought of using it to access overpass-turbo. Then, I made a SIB leaderboard using REST Call and Budibase internal database. But over time, I wanted to store and plot historical data. I also wanted to analyze the data the way I wanted outside Budibase. I thought of hosting data myself. I have a personal CouchDB storing all kinds of data, and Budibase supports accessing external CouchDB data natively. So that’s the way I went.
Table of Contents
Design
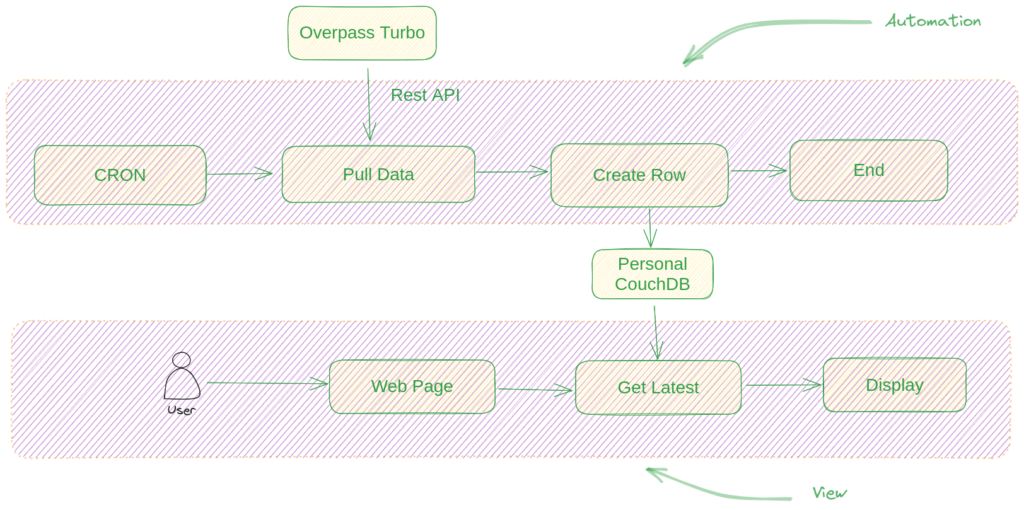
The overall design is straightforward. I have a Budibase automation that gets triggered based on CRON config. It calls the overpass-turbo API to get the data. I massage the data the way I want, then store it in the SIB database in my CouchDB. I use ISO formatted date as the primary key ( _id) and store one record per day.
When the user tries to view the leaderboard, I fetch the latest record, massage the data into a format suitable for table view, and show it in a table. That’s all.
Automation
Start by creating an app in Budibase. Then, under data source, add a Rest API to pull the data from the turbo OSM. And then one more Data source to create a record in our CouchDB. Our Automation will use these two. To make the Automation, go to the Automation tab, use CRON as the trigger, then. Add pulling data as step one and creating row in CouchDB as step two.

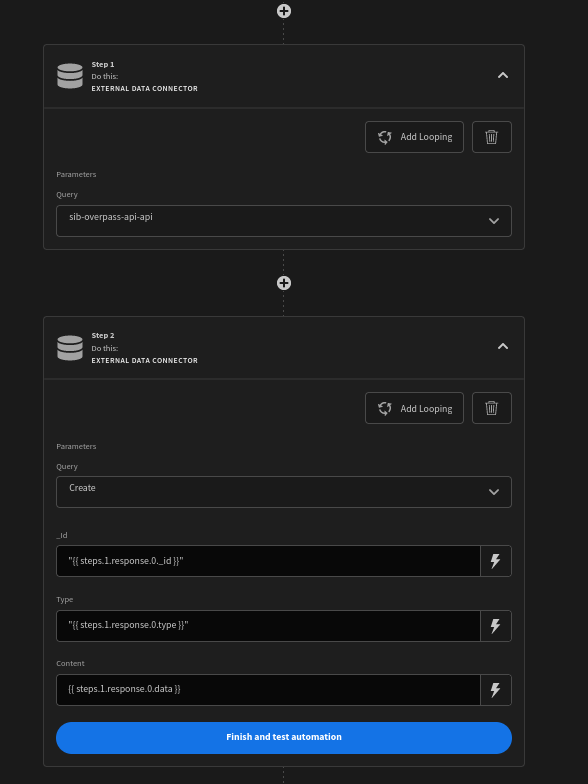
Step two which is creating a row in the CouchDB uses the data produced by step one.
Step 1: Pull data from OSM
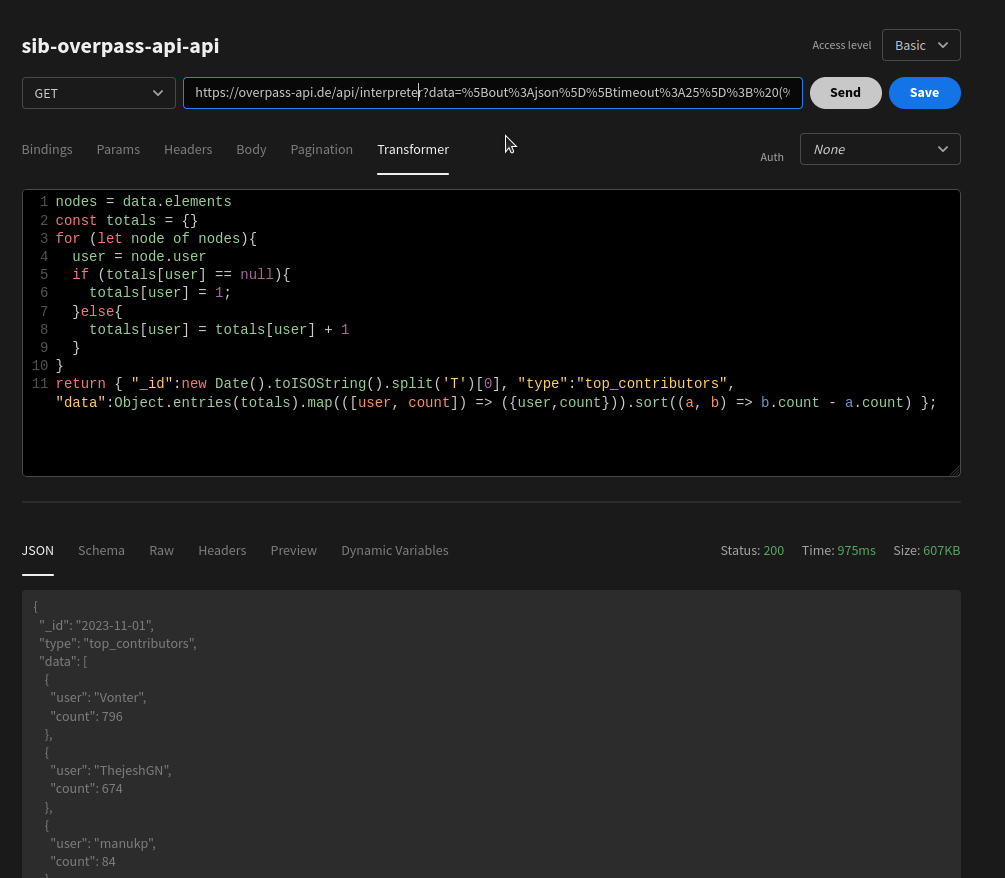
So, there is no direct way to get the count of contributions per use in the turbo-osm, but it lists each contribution. So, we iterate and count the user contribution in the transformer. Assign this to the data attribute and create an _id attribute with today’s date. And return the object.
Step 2: Add a record into CouchDB
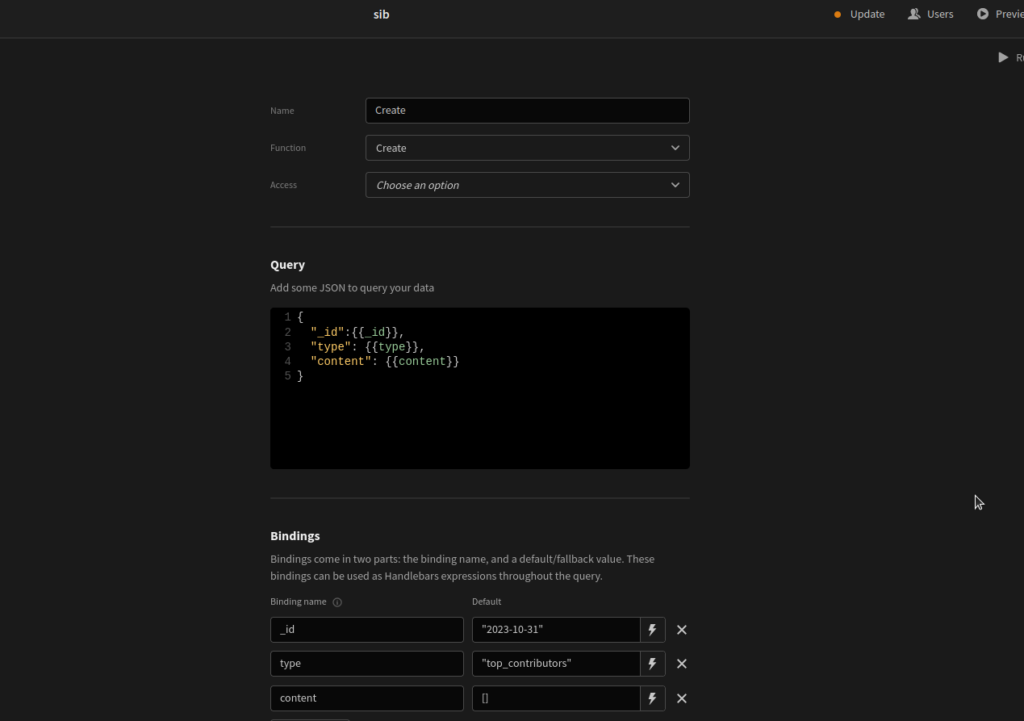
This is very simple: use CouchDB create query and set up the query bindings. As you can see, I use the attribute name as content in my database document instead of data.
In the automation configuration above for step 2; you can see that content binding is set using the data from {{steps.1.response.0.data}} from the step 1 ( turbo-osm call ). The Document in the CouchDB for a day will look like this
{
  "_id": "2023-11-01",
  "type": "top_contributors",
  "content": [
    {
      "user": "Vonter",
      "count": 796
    },
    {
      "user": "ThejeshGN",
      "count": 674
    },
    ....//more user
  ],
  "createdAt": "2023-11-01T08:15:08.957Z",
  "updatedAt": "2023-11-01T08:15:08.957Z"
}
That’s it. That’s our job aka automation.
View
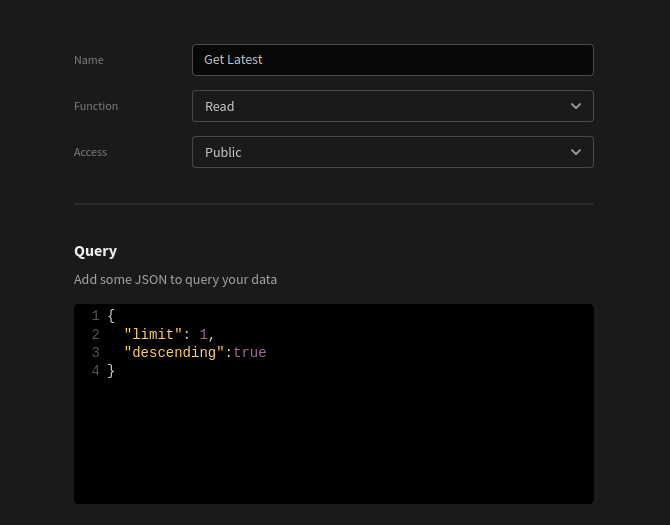
For viewing, when the page is accessed by a user ( Public Access), we will call the “Get Latest” data source, which is just a get-call on CouchDB against the database. But we want only the latest record, so we are setting the CouchDB query to sort by descending order ( of the keys ) and limit only one row. Then, we flatten the result using transformer to return an array of objects containing dt (same as _id), user, and count.
Get Latest
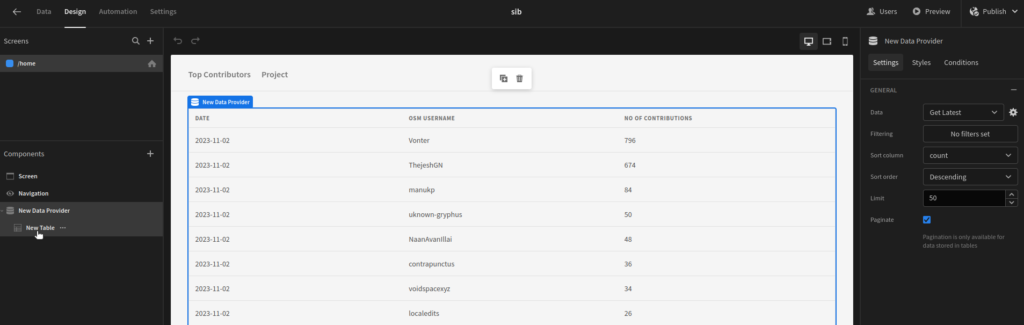
Display
Then, the front-end table is used to display this; that’s all. Allow public access to the page so anyone can see it without authenticating.
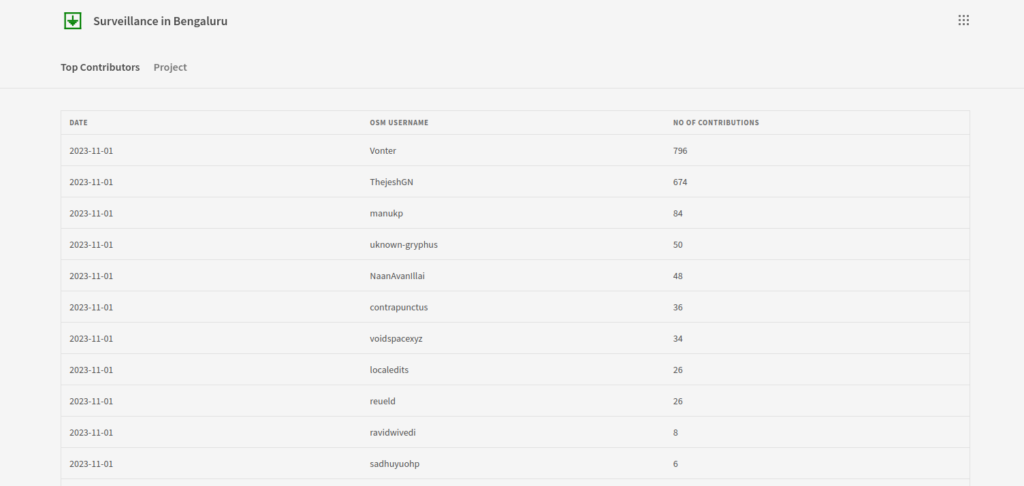
Final Results
A simple page with the table listing the latest contribution count, aka our leaderload.
Next
The idea behind storing the data is to draw historical graphs that chart the project’s growth. And maybe also add some user-level graphs. I will let you know when I do that. Until then, you can track the top contributors here.
This also makes Budibase and CouchDB a viable combination to build simple apps online by combining actions and piping data. I might build some more apps.


1 Response
[…] Budibase is a FOSS, and it's a big advantage. This week, I wrote a how-to about creating the SIB leaderboard app using this […]