Tracking API Performance over time
Testing and Tracking the performance of APIs is not a one-time activity. As the APIs are built and improved over time, we need to track them. It’s important to correlate what changes in business logic changed the performance. Of course, you can get the real data from the production and tag it to the version of the APIs. But there is value in running the API against a predefined setup and measure. It gives you data that can be used while in development and removes the variation due to an unpredictable production environment.
There are many ways to do it. You can set up the CI/CD to run tests and tag it to your changeset (Patch, Pull Request, or Merge Request). But over time, it becomes difficult to track and compare, especially if there is no dashboard to look at it.
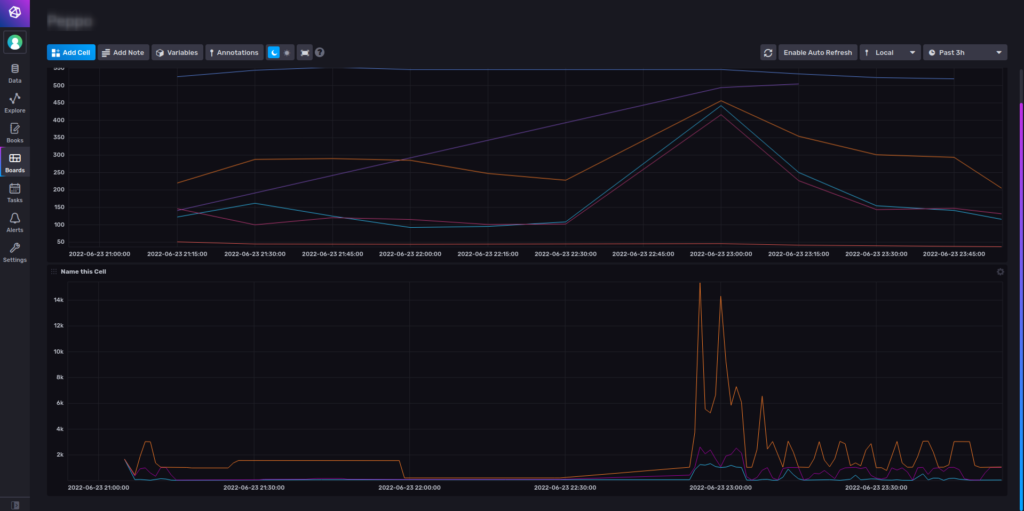
We have been using JMeter to create and run our test cases. JMeter has a way to capture the performance data and send it to a time series database like InfluxDB2. InfluxDB has charts and boards that you can use to view the database. Based on your InfluxDB2 data bucket settings, you can save the data forever to compare and contrast. With this setup, you can view test results live if the tests are running on a different machine or in non GUI mode.
On InfluxDB
- Create a bucket, say jmeter
- Create an API token that has read/write permissions to this bucket
- Note down the organization code
In JMeter
- Right click on the Test Plan
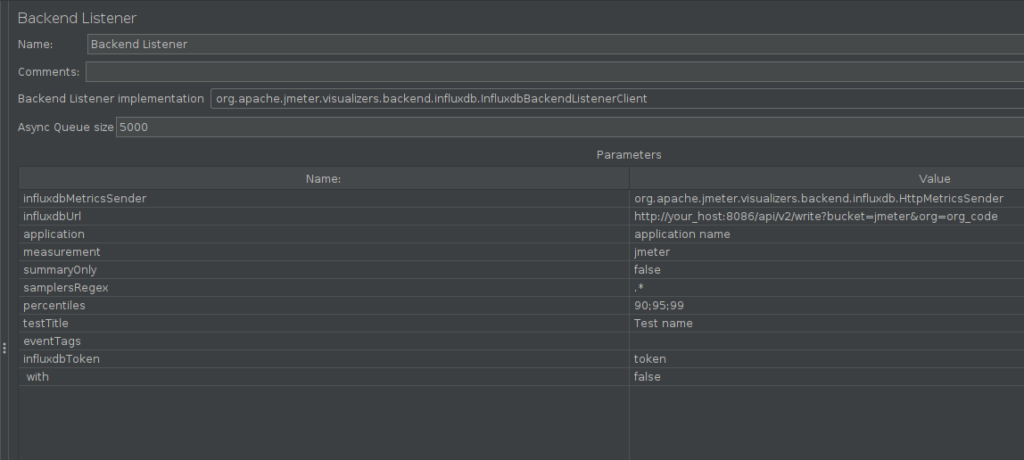
- Add -> Listener -> Backend Listener
- In “Backend Listener Implementation” choose InfluxdbBackendListenerClient
- Update influxdbUrl to your influxdb url, it looks like http://your_host:8086/api/v2/write?bucket=jmeter&org=org_code
- In the above URL you might have to change your_host, bucket and org_code
- Add influxdbToken with the value of the InfluxDB2 API Token
- Change summaryOnly to false as we want to get everything
- Change application to your application name
Of course, other similar backends are available to capture and send this data in real-time, for example, Graphite. You could use a non time-series database too, if that makes sense. JMeter’s BackendListerner is quite flexible, and you can implement your own by extending AbstractBackendListenerClient.
You can also play with the settings or parameters you want to capture and store based on your requirements. Go ahead and experiment as much as you can until you are happy.
I am used to working with InfluxDB, so I used that. I use the built-in boards feature to create my dashboard. It works well for me.
So how do you measure and track the performance of your APIs?