Author: Thejesh GN

0

Building an Alexa Skill using OpenWhisk and CouchDB

Smart Speakers are becoming popular these days. I see Alexa or Google home everywhere, Voice is an interesting technology and I think it’s going to become very popular amongst younger and elderly community. Here in this tutorial we will create a simple Alexa Skill using OpenWhisk as our serverless platform and CouchDB as our database.


Attaching the notebook to passport holder is easy using an elastic band. 0

Custom Notebooks

I love notebooks. Since school days I have been fan of pocket-able notebooks. The one’s that reporters use. When I was in school I used carry empty prescription pads of my dad 1. I loved them because they used to fit well in my pocket. When I started working I moved to bigger...

Using Netatmo and Pushover API to get weather alerts. 1

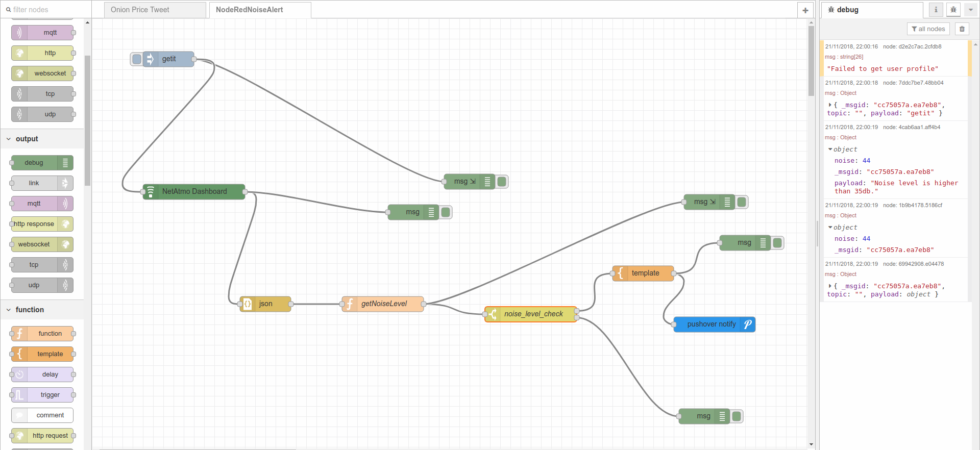
How to setup and run Node-Red

Table of Contents1 Install and setup2 Setup your flow3 API Access4 End Note Node-Red is IBM open source project for wiring things on internet. It was started by IBM’s Emerging Technology Services team and now is part of JS Foundation, For anyone who has been a fan of Yahoo Pipes the interface and...

Screenfrab from Google Walkout: Employees Stage Protest Over Handling of Sexual Harassment Video. 0

Google Walkouts

One of the early cases of sexual harassment that I remember reading about is that of Phaneesh Murthy in 2002. When I joined Infosys in 2003 it was hot topic. There were discussions about how Infosys fired him; unhappiness about the compensation Infosys had to pay etc. I was mostly disgusted by the...

Official External boundaries of India Provided by Survey of India. 0

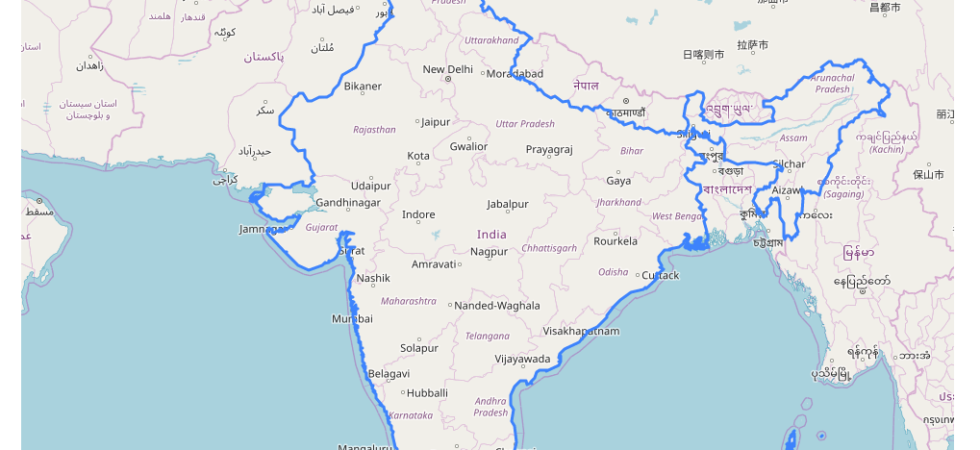
Download Official External boundaries of India by Survey of India

For a long time the Indian OpenStreetMap community and DataMeet Community was looking for an official external boundaries. Even-though the commercial counter parts had it, the community didn’t have access to it. That status has changed now. Now we have the official external boundaries of India by Survey of India out in public...

Line graph of PM 2.5 0

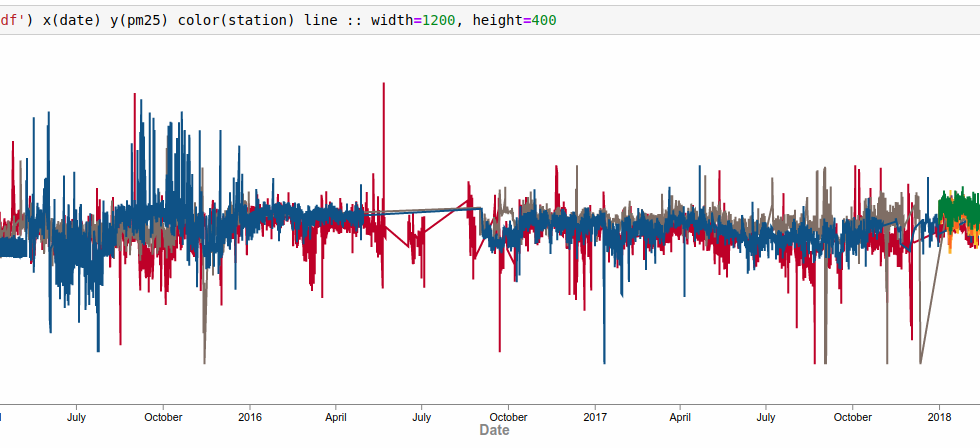
Visualizing Air pollution in Bangalore using Brunel

Brunel defines a highly succinct and novel language that defines interactive data visualizations based on tabular data. Brunel is Visualization language. It’s a domain specific language. It has its own grammar. It feels familiar to anyone who thinks in data and want to visualize it. Brunel is also open source and works well...