Live chart showing IDVC Prices
I have added live charts to the IDVC ( Idly Dose Vada Coffee Price) project page. It’s the current year’s stats.
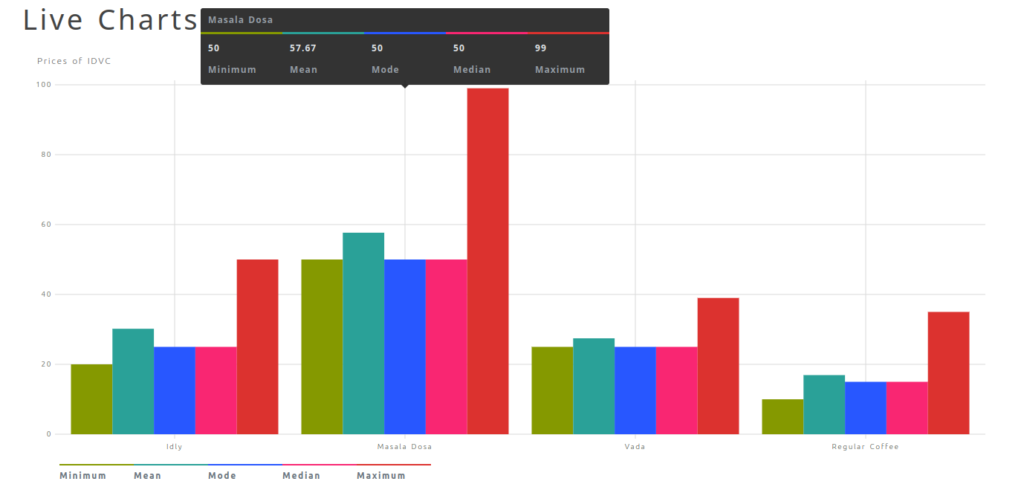
As we add more data, we might have charts showing the increase in prices year on year. Since this is the first year, it offers the current (2022) year’s prices. The graph displays each dish’s Minimum, Mean, Median, Mode and Maximum prices. The stat object looks like this.
{
    "_id": "current_stats",
    "_rev": "2-6afd32f349076c00c1dedddc617fc939",
    "type": "stat",
    "idly_two":
    {
        "max": 50,
        "min": 20,
        "mean": 30.18,
        "median": 25,
        "mode": 25,
        "sd": 8.91
    },
    "masala_dosa":
    {
        "max": 99,
        "min": 50,
        "mean": 57.67,
        "median": 50,
        "mode": 50,
        "sd": 15.9
    },
    "vada":
    {
        "max": 39,
        "min": 25,
        "mean": 27.45,
        "median": 25,
        "mode": 25,
        "sd": 4.34
    },
    "regular_coffee":
    {
        "max": 35,
        "min": 10,
        "mean": 16.92,
        "median": 15,
        "mode": 15,
        "sd": 6.27
    },
    "last_updated_on": "2020-07-05T15:45:00.000+05:30"
}
If you think of any other exciting graphs that I can do either using live data or calculated data. Leave a comment. I might add it. Currently, I am working on dividing Bangalore into different sections geographically and comparing the prices. But I am not sure how to divide Bangalore. I am thinking of using BBMP zones. But not sure yet. If you have ideas leave a comment.


1 Response